. 2022 Oct 3;11:e77073. doi: 10.7554/eLife.77073

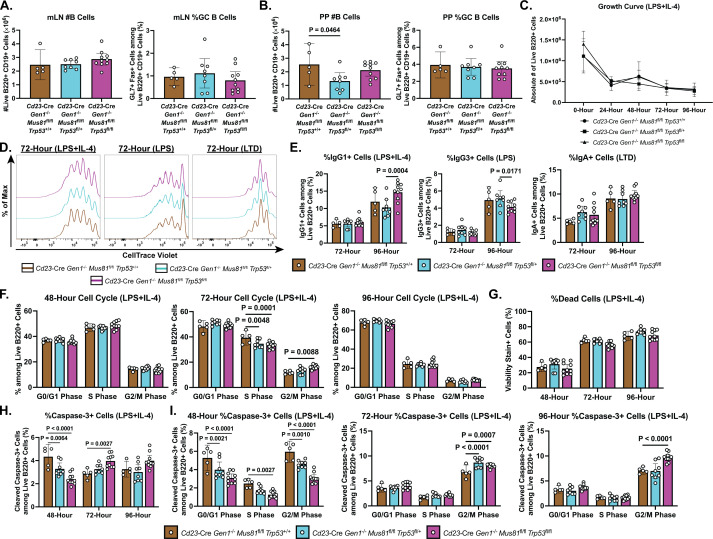
Figure 4. RNA-seq and gene set enrichment (GSEA) analyses of activated control and DKO B cells.

(A) Volcano plot depicting the differential gene expression between control and DKO cells. Labeled squares indicate the top 15 most significantly upregulated genes and the labeled triangles are the 10 most downregulated genes in DKO cells. Using the Hallmark Gene Sets as reference, genes labeled in blue are categorized as genes in the p53 pathway while those labeled in red are defined as interferon alpha (IFN-α) response genes. Purple symbols mark Gen1 and Mus81. (B) Graph depicting the list of Hallmark Gene Sets that are differentially expressed between control and DKO cells (FDR<0.05). Value in each bar denotes the FDR for that gene set. (C) Heatmaps displaying the relative expression of genes within the indicated Hallmark Gene Sets that meet the expression cutoff (log2 fold change>1 for p53 pathway; >0.5 for apoptosis and interferon alpha response; <–0.3 for G2/M checkpoint; with FDR<0.05). Data are from six mice per genotype. The labels ‘1’ and ‘2’ represent male and female mice, respectively, and ‘A’ to ‘C’ indicate the three experimental ex vivo groups.

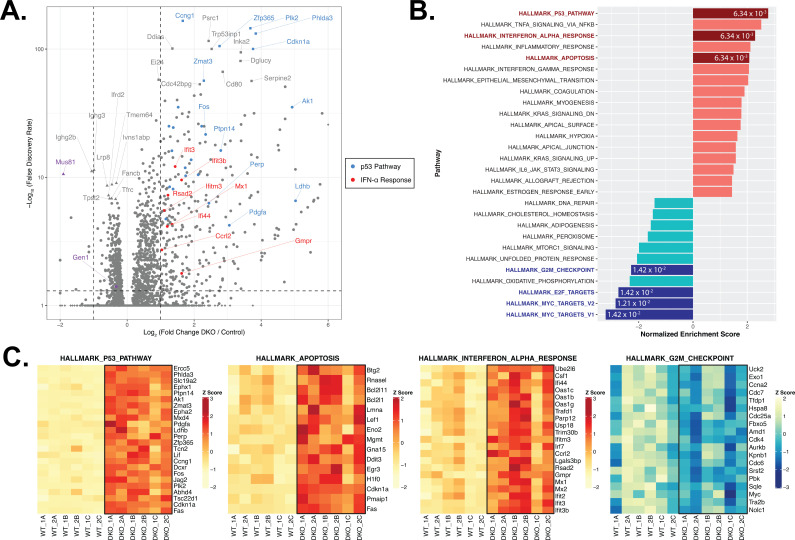
Figure 4—source code 1. R script to generate Figure 1A, Figure 4, and Figure 4—figure supplement 1.
Figure 4—source code 2. Bash script to clean and align FASTQ files.
Figure 4—source code 3. Bash script to count gene alignments.
Figure 4—source data 1. Differential expression between control and DKO B cells.

Figure 4.

Figure 4—figure supplement 1. Transcriptomics and gene set enrichment (GSEA) analyses of ex vivo-activated control, GKO, and MKO B cells.

Figure 4—figure supplement 1.

(A) Table listing the first five genes and the corresponding log2 fold change, p value, and FDR generated from the DESeq analysis comparing Gen1+/− Mus81fl/fl (control) and Gen1−/− Mus81fl/fl (GKO) B cells. (B) Volcano plot displaying the differential gene expression between control and Cd23-Cre Gen1+/− Mus81fl/fl (MKO) cultures at 48-hr post-stimulation. Purple dots indicate the top 10 significantly upregulated genes, and the green dots indicate genes that are de-enriched. (C) Table listing the genes that are differentially expressed between GKO and MKO B cells. (D) GSEA plots of the Hallmark Gene Sets enriched in DKO cells. (E) GSEA plots of the Hallmark Gene Sets de-enriched in DKO cells. (F) Heatmap depicting the genes within the indicated Hallmark Gene Sets that had a log2 fold change of ≤–0.3 and FDR of <0.05 in DKO cells relative to control. Data are from six mice per genotype. The labels ‘1’ and ‘2’ represent male and female mice, respectively, and ‘A’ to ‘C’ denote the three experimental ex vivo groups.
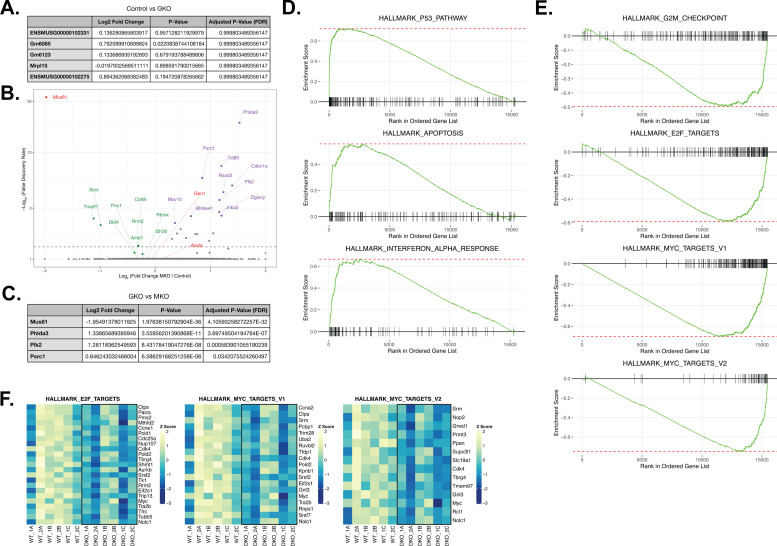
Figure 4—figure supplement 1—source data 1. Differential expression between control and GKO B cells.
Figure 4—figure supplement 1—source data 2. Differential expression between control and MKO B cells.
Figure 4—figure supplement 1—source data 3. Differential expression between GKO and MKO B cells.
Figure 4—figure supplement 2. In vivo and ex vivo phenotyping of DKO Trp53-WT, DKO Trp53-Het, and DKO Trp53-KO B cells.

Figure 4—figure supplement 2.

(A, B) Absolute number of total B cells and frequency of GC B cells in the mesenteric lymph nodes (A) and Peyer’s patches (B) of mice for each indicated genotypes. (C) Growth curve of LPS+IL-4 (LI)-activated splenic B cell culture. (D) Representative CTV dilution plots of activated B cells at 72-hr post-stimulation. (E) Frequency of IgG1, IgG3, and IgA class-switched cells after 72 and 96 hr of stimulation in LI, LPS, and LTD cultures, respectively. (F) Cell cycle profile of LI-stimulated B cells after 48, 72, and 96 hr of culture represented by the frequency of live B cells in G0/G1, S, and G2/M phases. (G) Frequency of dead B cells at 48-, 72-, and 96-hr post LI-activation. (H) Fraction of live B cells undergoing apoptosis as defined by positive staining for anti-cleaved caspase-3 antibody after 48, 72, and 96 hr of LI culture. (I) Cell cycle phase-specific assessment of apoptosis. Frequency of cleaved caspase-3+ B cells in G0/G1, S, and G2/M phases at 48, 72, and 96 hr post-stimulation in LI culture. Data in (A–I) are from two independent experiments with 5–10 mice per genotype. Bars represent arithmetic mean and error bars denote 95% confidence intervals of the measured values. P values were computed using one-way ANOVA analysis (A, B) and two-way ANOVA analysis (E–I) with Dunnett’s multiple comparison test wherein the mean of the DKO Trp53-KO group was compared to the others.