. 2022 Oct 3;11:e77073. doi: 10.7554/eLife.77073

Figure 5. Metaphase chromosomal analysis of activated DKO B cells.

(A) Representative image of a DKO metaphase spread with arrows indicating chromosomal breaks, fragments, and fusions in metaphases of activated DKO B cells. (B) Quantification of the average number of chromosomal aberrations across 45–50 metaphase spreads prepared from each B cell culture. (C) Percentage breakdown of metaphases exhibiting 0 to greater than 5 chromosomal aberrations. (D) Fraction of metaphases containing the indicated types of chromosomal abnormalities. Total percentage per genotype exceeds 100% as some metaphases exhibit more than one type of abnormality. (E) Proportion of chromatid and chromosome breaks among the 163 breaks observed in DKO metaphase spreads exhibiting at least one break. (F) Tel-FISH images of DKO metaphases highlighting the proximal location of the chromosomal damage to the telomeres. Note that the events labeled as dicentrics here and in Figure 5—figure supplement 1 may include chromosomes with residual cohesins remaining at a repaired DSB and those with condensins that persist after loading onto the chromosomal arms during mitotic entry. Data in (B–E) are from three independent experiments with 5 mice (totaling between 215 and 235 metaphase spreads) per genotype. For (C), the percentages are the average of the data combined from all five mice. Bars display the arithmetic mean and error bars represent the 95% confidence interval of the measured parameters. P values were computed with ordinary one-way ANOVA analysis (B, D) and the Kruskal-Wallis test (C) with Dunnett’s multiple comparisons test without pairing. Means of all groups were compared to that of Cd23-Cre Gen1−/− Mus81fl/fl.

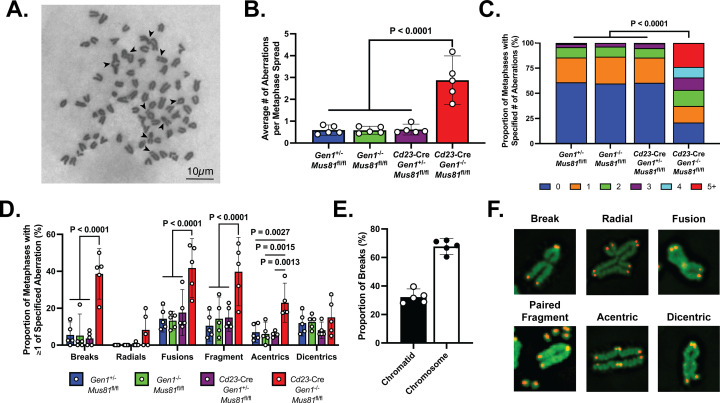
Figure 5.

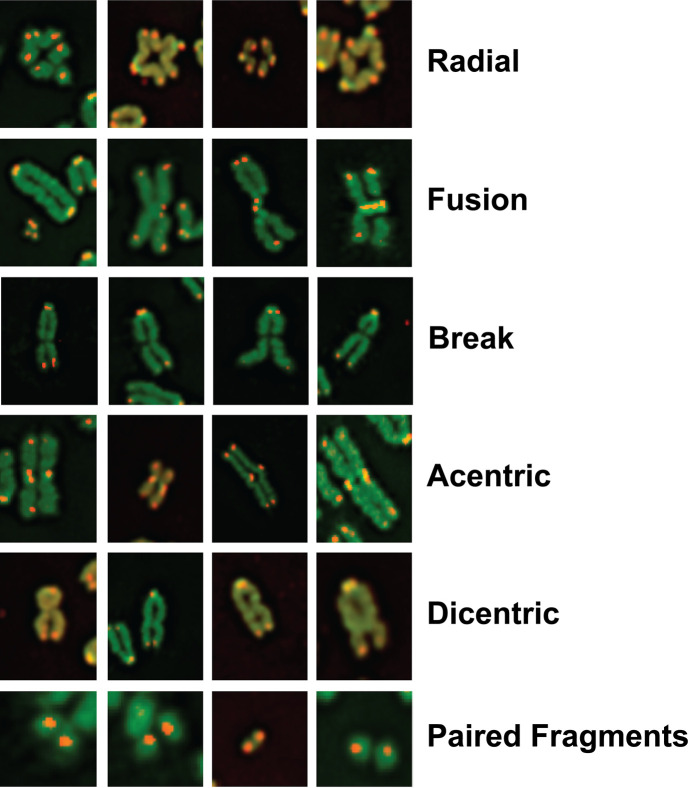
Figure 5—figure supplement 1. Telomere FISH analysis of metaphase spreads prepared from ex vivo-activated DKO B cells.

Figure 5—figure supplement 1.

Representative immunofluorescence images depicting in the context of stained telomeric DNA the various aberrations occurring in DKO B cells activated for 48 hr with LPS+IL-4.
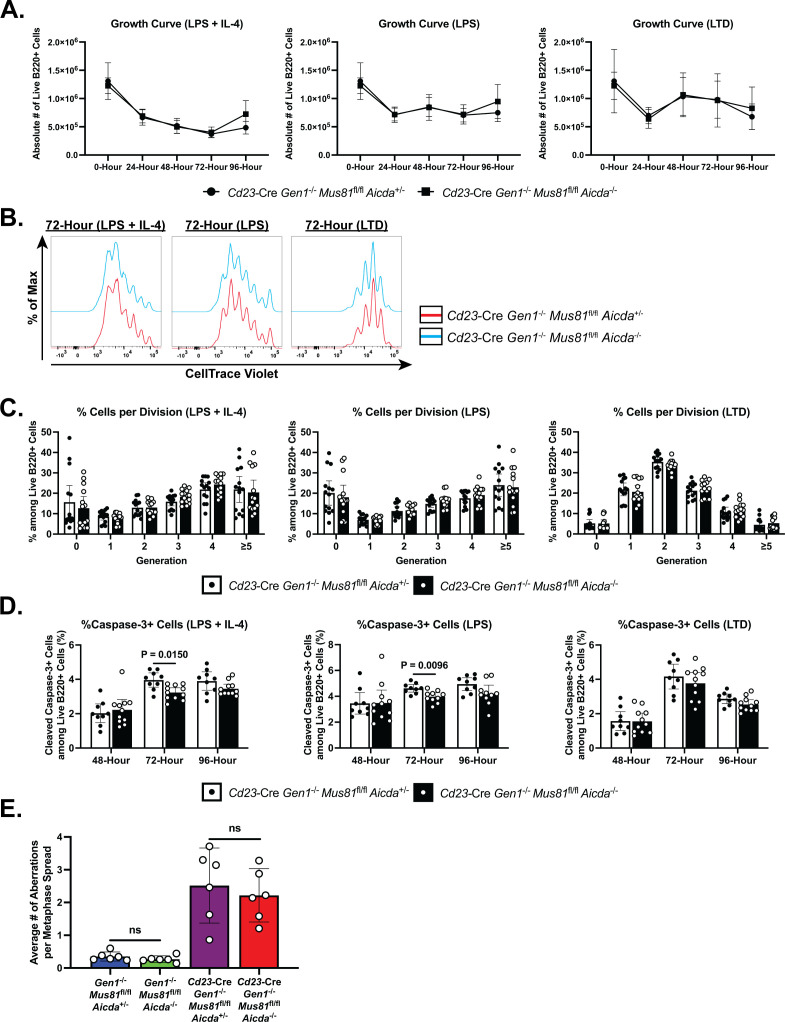
Figure 5—figure supplement 2. Proliferation dynamics, viability, and chromosomal analyses of DKO Aicda-Het and DKO Aicda-KO ex vivo cultures.

Figure 5—figure supplement 2.

(A) Growth curves of activated DKO Aicda-Het and DKO Aicda-KO splenic B cells. (B, C) Proliferation dynamics of DKO Aicda-Het and DKO Aicda-KO B cells in ex vivo cultures. Representative CTV dilution plot at 72-hr post-stimulation (B) and percentage of cells in each cell division (C) quantified at 72 hr after activation with LPS+IL-4, LPS, and LTD. (D) Frequency of cleaved caspase-3+ cells among ex vivo-activated B cells at 48-, 72-, and 96-hr post-stimulation. (E) Quantification of the average number of chromosomal aberrations present across all metaphase spreads of B cells isolated from each mouse of the indicated genotypes and activated with LPS+IL-4 for 48 hr. Data in (A–C) are from five independent experiments with 14 mice per genotype. Data in (D) are from three independent experiments with 9–11 mice per genotype. Data in (E) are from three independent experiments with six mice for each indicated genotype. Between 298 and 300 metaphase spreads were examined for each genotype. Bars display the arithmetic mean and error bars represent the 95% confidence interval of the measured parameters. P values in (C) and (D) were calculated using mixed-effects two-way ANOVA analysis with Šidák multiple comparisons test. For (E), p values were enumerated using ordinary one-way ANOVA analysis with Dunnett’s multiple comparisons test without pairing.