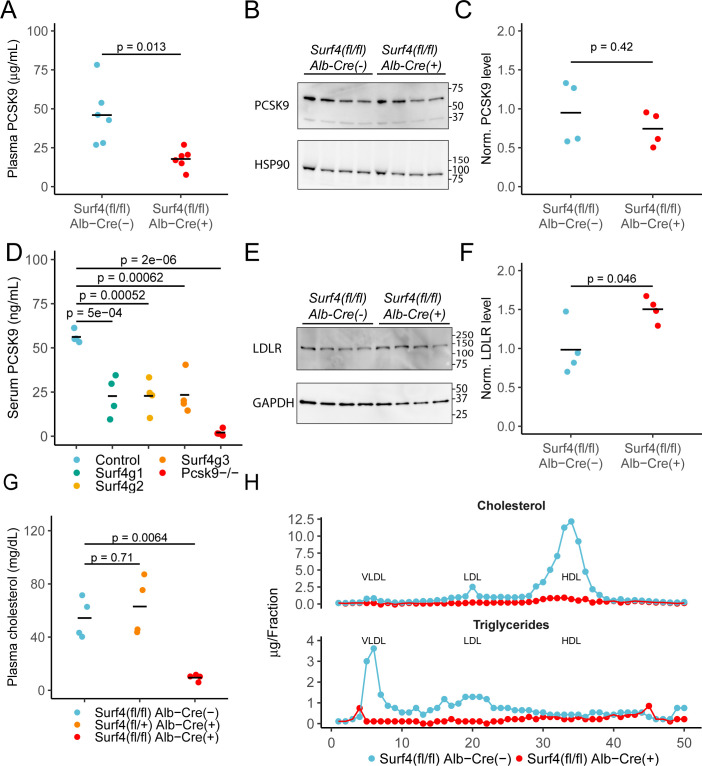
Figure 2. Deletion of hepatic Surf4 results in decreased serum PCSK9 level and profound hypocholesterolemia in mice.
(A) Serum PCSK9 levels measured by ELISA in Surf4fl/fl Alb-Cre+ mice and Surf4fl/fl Alb-Cre- littermate controls (n=6 per genotype). (B) Immunoblot for PCSK9 and HSP90 (loading control) in liver lysates collected from control and Surf4fl/fl Alb-Cre+ mice (n=4 per genotype) (Figure 2—source data 1). (C) Quantification of liver PCSK9 levels presented in (B) (n=4 per genotype). (D) Serum PCSK9 levels in mice in which hepatic Surf4 was acutely inactivated by CRISPR/Cas9 (n=4 per group). (E) Immunoblot of liver lysates collected from control and Surf4fl/fl Alb-Cre+ mice (n=4 per genotype) for LDLR and GAPDH (loading control) (Figure 2—source data 1). (F) Quantification of liver LDLR levels presented in (E). (G) Steady-state plasma cholesterol levels in 2 months old control (Surf4fl/fl Alb-Cre-), heterozygous (Surf4fl/+ Alb-Cre+), and homozygous (Surf4fl/fl Alb-Cre+) Surf4 deleted mice. (H) Fractionation of lipoproteins in mouse serum by fast protein liquid chromatography (FPLC). Cholesterol and triglyceride levels were measured in each fraction. Each control and Surf4fl/fl Alb-Cre+ sample was pooled from sera of 5 mice. Fractions corresponding to VLDL, LDL, and HDL are annotated. Crossbars represent the mean in all plots. For comparisons between control and Surf4fl/fl Alb-Cre+, p-values were calculated by two-sided Student’s t-test. For comparison between control, heterozygous, and Surf4fl/fl Alb-Cre+ mice, p-values were obtained by one-way ANOVA test followed by Tukey’s post hoc test. Molecular weight markers notated are in kDa.
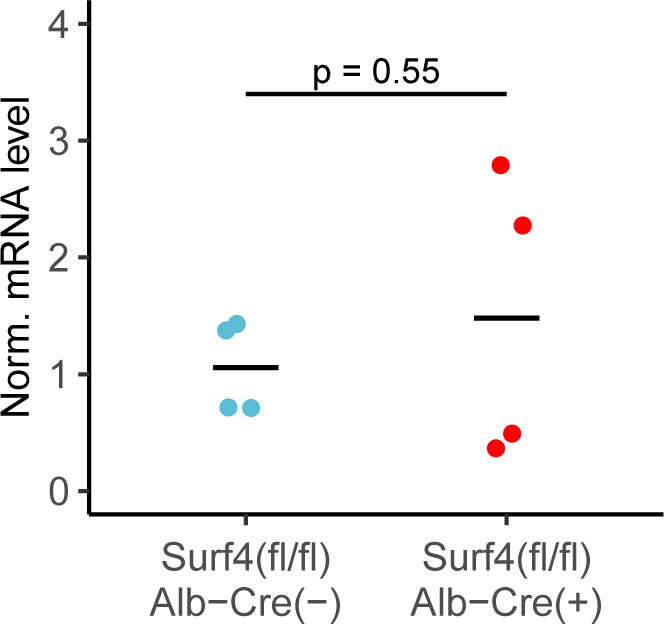
Figure 2—figure supplement 1. Normalized (Norm) Pcsk9 mRNA levels in Surf4fl/fl Alb-Cre-.and Surf4fl/fl Alb-Cre+ mice.


