. 2022 Oct 4;11:e82669. doi: 10.7554/eLife.82669

Figure 3. CD81 and CD44 are required for exosome-induced cancer stemness.

Transmission electron microscopy images (A) of WT, 44KO, and 81KO MDA-MB-231 cells and number of vacuoles observed per cell (B). Yellow arrows point to vacuoles or early endosomes/endocytic vesicles, purple arrows to multivesicular bodies. Scale bar = 500 nm. N= 6. Error bars represent standard deviation. Student two-tailed T-test *p = 0.017. (C) Counts of extracellular vesicles (EVs) per cell in crude culture supernatants of WT, 44KO, and 81KO cells, measured by Apogee (N = 3 or 5). Error bars represent standard deviation. Two-tailed Student T-test ****p = 0.0001, **p = 0.003, one-tailed Student T-test *p = 0.036. Nanoparticle tracking analysis (NTA)-based size distributions (repeated three times) (D) and (E, F) representative immunoblots (n = 3) and quantification for EV proteins in ultracentrifuge-isolated EV particles from the culture media of WT, 44KO, and 81KO MDA-MB-231 cells. N= 3. Error bars represent standard deviation. T-test *p = 0.04/0.02 (one tailed), **p = 0.001 (two tailed), ***p = 0.0002 (two tailed), ****p = 8.5e−6 (two tailed). Cryo-EM images (repeated twice) (G) and quantification (H) of membrane integrity in evWT, ev44KO, and ev81KO, taken at ×8000 nominal magnification (a pixel size of 4.125 Å). Vesicles assessed included 18 WT, 17 CD44KO, and 63 CD81KO. Scale bar = 200 nm. (I) Schematic of 81KO MDA-MB-231 cells educated with phosphate-buffered saline (PBS) or evWT, ev44KO, and ev81KO every 2 days for 2 weeks and seeded at low density to evaluate mammosphere formation. Representative images (J) and bar graph quantification (K) of mammospheres 4 days after seeding of 1000 cells per well (24-well plate) after education with PBS, WT EVs, CD44KO EVs, and CD81KO EVs. Scale bar = 100 µm. N= 4. Error bars represent standard deviation. One-tailed Student T-test *p = 0.02, **p = 0.01. Repeated twice times.

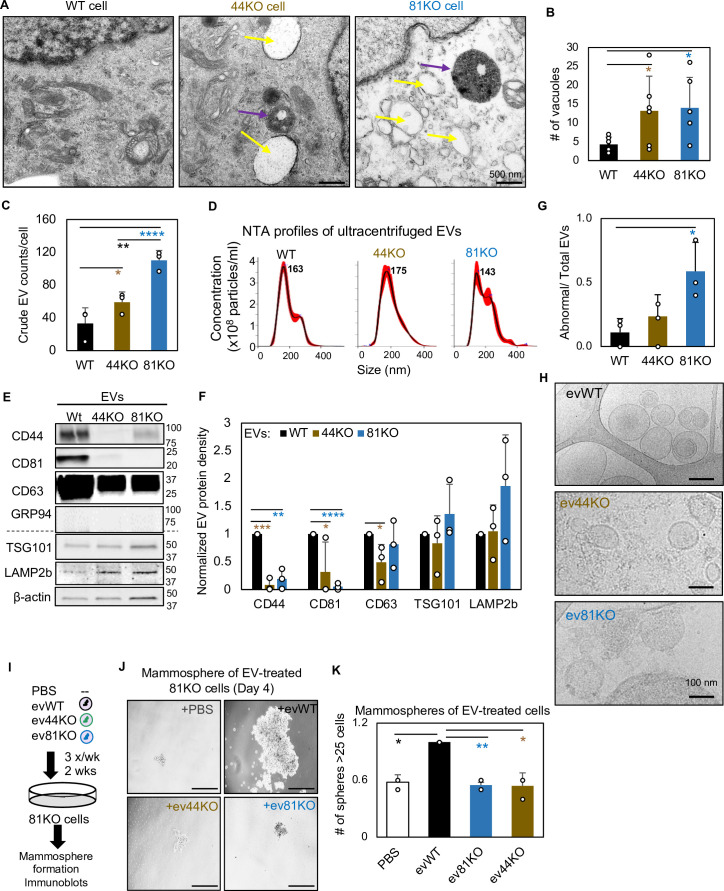
Figure 3—source data 1. Uncropped blots associated with Figure 3E.

Figure 3.

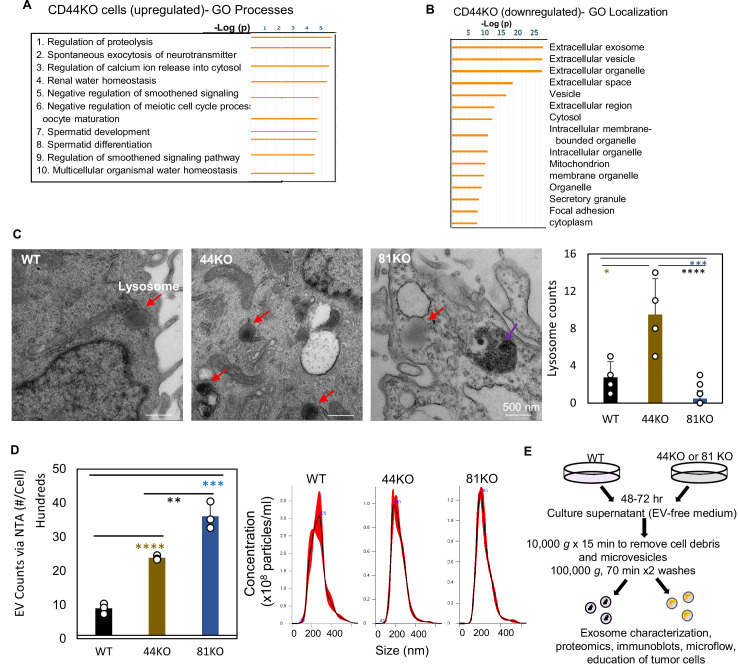
Figure 3—figure supplement 1. Effects of CD44/CD81 depletion on cellular pathways related to extracellular vesicles (EVs).

Figure 3—figure supplement 1.

(A) GO Localization analysis of downregulated proteins in pooled CD44KO cells compared to WT MDA-MB-231 cells (N = 3 replicates, p < 0.05). (B) GO Processes analyses of global mass spectrometry-based upregulated proteins in the CD44KO cells in comparison to CD44 WT MDA-MB-231 cells. (C) Transmission electron microscopy image and quantification of lysosomes (red arrows) in MB-MDA-231 cells. Scale bar = 500 nm. N= 4. Error bars represent standard deviation. Student two-tailed T-test *p = 0.02, ***p = 5e−04, ****p = 2e−09. The purple arrow points to a multivesicular body (MVB) which is not significant different among three types of cells (1 or 0 observed per cell). (D) Left panel: nanoparticle tracking analysis (NTA) counts of EVs per cell in purified EVs (100,000 × g x 70 min) from WT, 44KO, and 81KO cells, measured by NanoSight (N = 3). Error bars represent standard deviation. Two-tailed Student T-test ****p = 0.0001, ***p = 0.0003, **p = 0.006. Right panel: NTA-based size distributions (repeated three times) of the three types of EVs. (E) Schematic of EV isolation by ultracentrifugation steps and characterization.
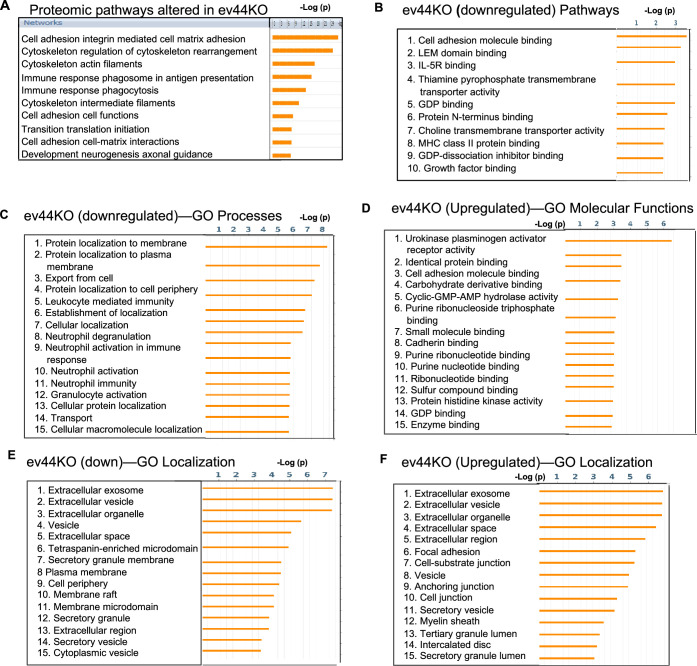
Figure 3—figure supplement 2. Proteomic pathway analysis of evCD44 derived from CD44KO cells.

Figure 3—figure supplement 2.

(A) Proteomic pathways altered in the extracellular vesicles (EVs) derived from CD44KO cells (ev44KO) compared to evWT from WT cells. (B–F) GO analyses of proteins down- or upregulated in the ev44KO versus evWT.
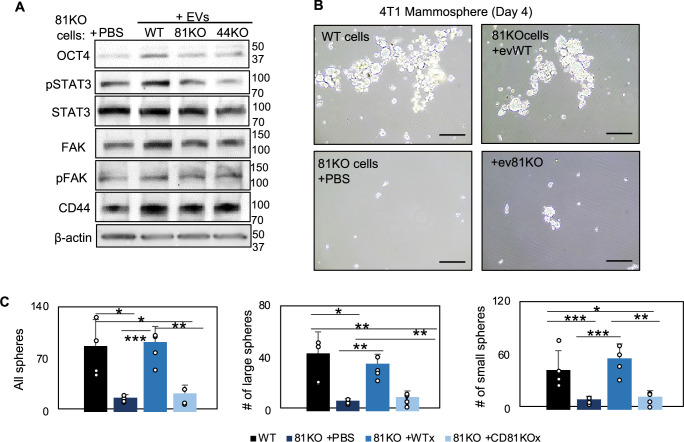
Figure 3—figure supplement 3. CD81 is required for exosome-induced effects on stemness phenotype.

Figure 3—figure supplement 3.

(A) Immunoblot analyses for OCT 4, STAT3, phosphoSTAT3 (pSTAT3), FAK, pFAK, CD44, and β-actin using CD81KO MDA-MB-231 cells educated with phosphate-buffered saline (PBS) or extracellular vesicles (EVs) derived from WT, CD81KO, and CD44KO, and CD81KO cells. (B, C) Representative images (B) and quantifications of mammospheres derived from 4T1 cells in suspension, including WT cells and Cd81KO cells, the latter of which were educated with PBS or exosomes (10 µg for 1 week). 2000 cells were seeded in 6-cm plates in mammosphere media, and the images were captured on day 4. N= 4. Error bars represent standard deviation. Two-tailed Student T-test was used *p<0.05, **p<0.005, ***p<0.001.
Figure 3—figure supplement 3—source data 1. Uncropped blots associated with Figure 3—figure supplement 3.