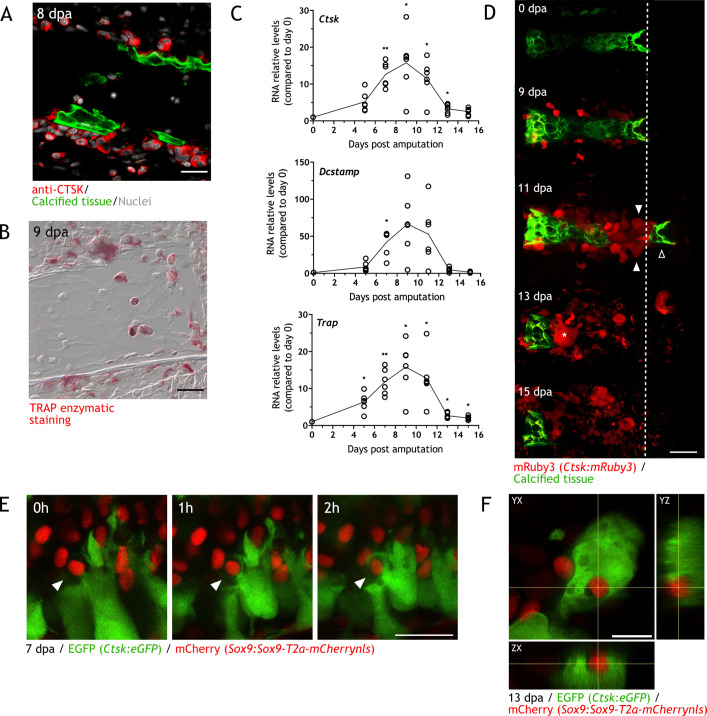
Figure 2. Osteoclasts are identified during skeletal resorption.
(A) Apotome image of immunofluorescence for anti-cathepsin K (CTSK; red) in zeugopod section at 8 dpa. Calcein was used for calcified cartilage labeling (green) and Hoechst for nuclear staining (white). Scale bar: 50 µm (n=2). (B) Tartrate-resistant acid phosphatase (TRAP) enzymatic staining in zeugopod section at 9 dpa. Scale bar: 50 µm (n=2). (C) RT-qPCR for Trap, Ctsk, and Dcstamp at different dpa upon zeugopodial amputation. Solid line represents mean, each dot is an animal (n=6. ** p<0.01, * p<0.05, one-way ANOVA, Bonferroni’s multiple comparisons test, each timepoint versus 0 dpa). (D) In vivo confocal imaging of Ctsk:mRuby3 (red) upon digit amputation. Calcein was used for calcified cartilage labeling (green). Image represents a maximum intensity projection of 10 images (3 µm interval). White arrowhead: mRuby3+ cells (osteoclasts). Black arrowhead: break in the skeletal tissue. Dashed line: amputation plane. Asterisk: multinucleated osteoclast. Scale bar: 100 µm (n=3). (E) In vivo confocal imaging of Sox9 × Ctsk at 7 dpa. Images were taking at time 0, 1, and 2hr. Image represents a maximum intensity projection of four images (3µm interval). White arrowhead: eGFP+ osteoclast engulfing mCherry+ chondrocyte. Scale bar: 50 µm (n=6). (F) Orthogonal view of in vivo confocal imaging from the Sox9 × Ctsk line at 13 dpa. Image is composed of 15 planes with a voxel depth of 2 µm. Center of cross shows mCherry+ cell phagocytosed by eGFP+ cell. Scale bar: 50 µm (n=6).


