
Figure 2.
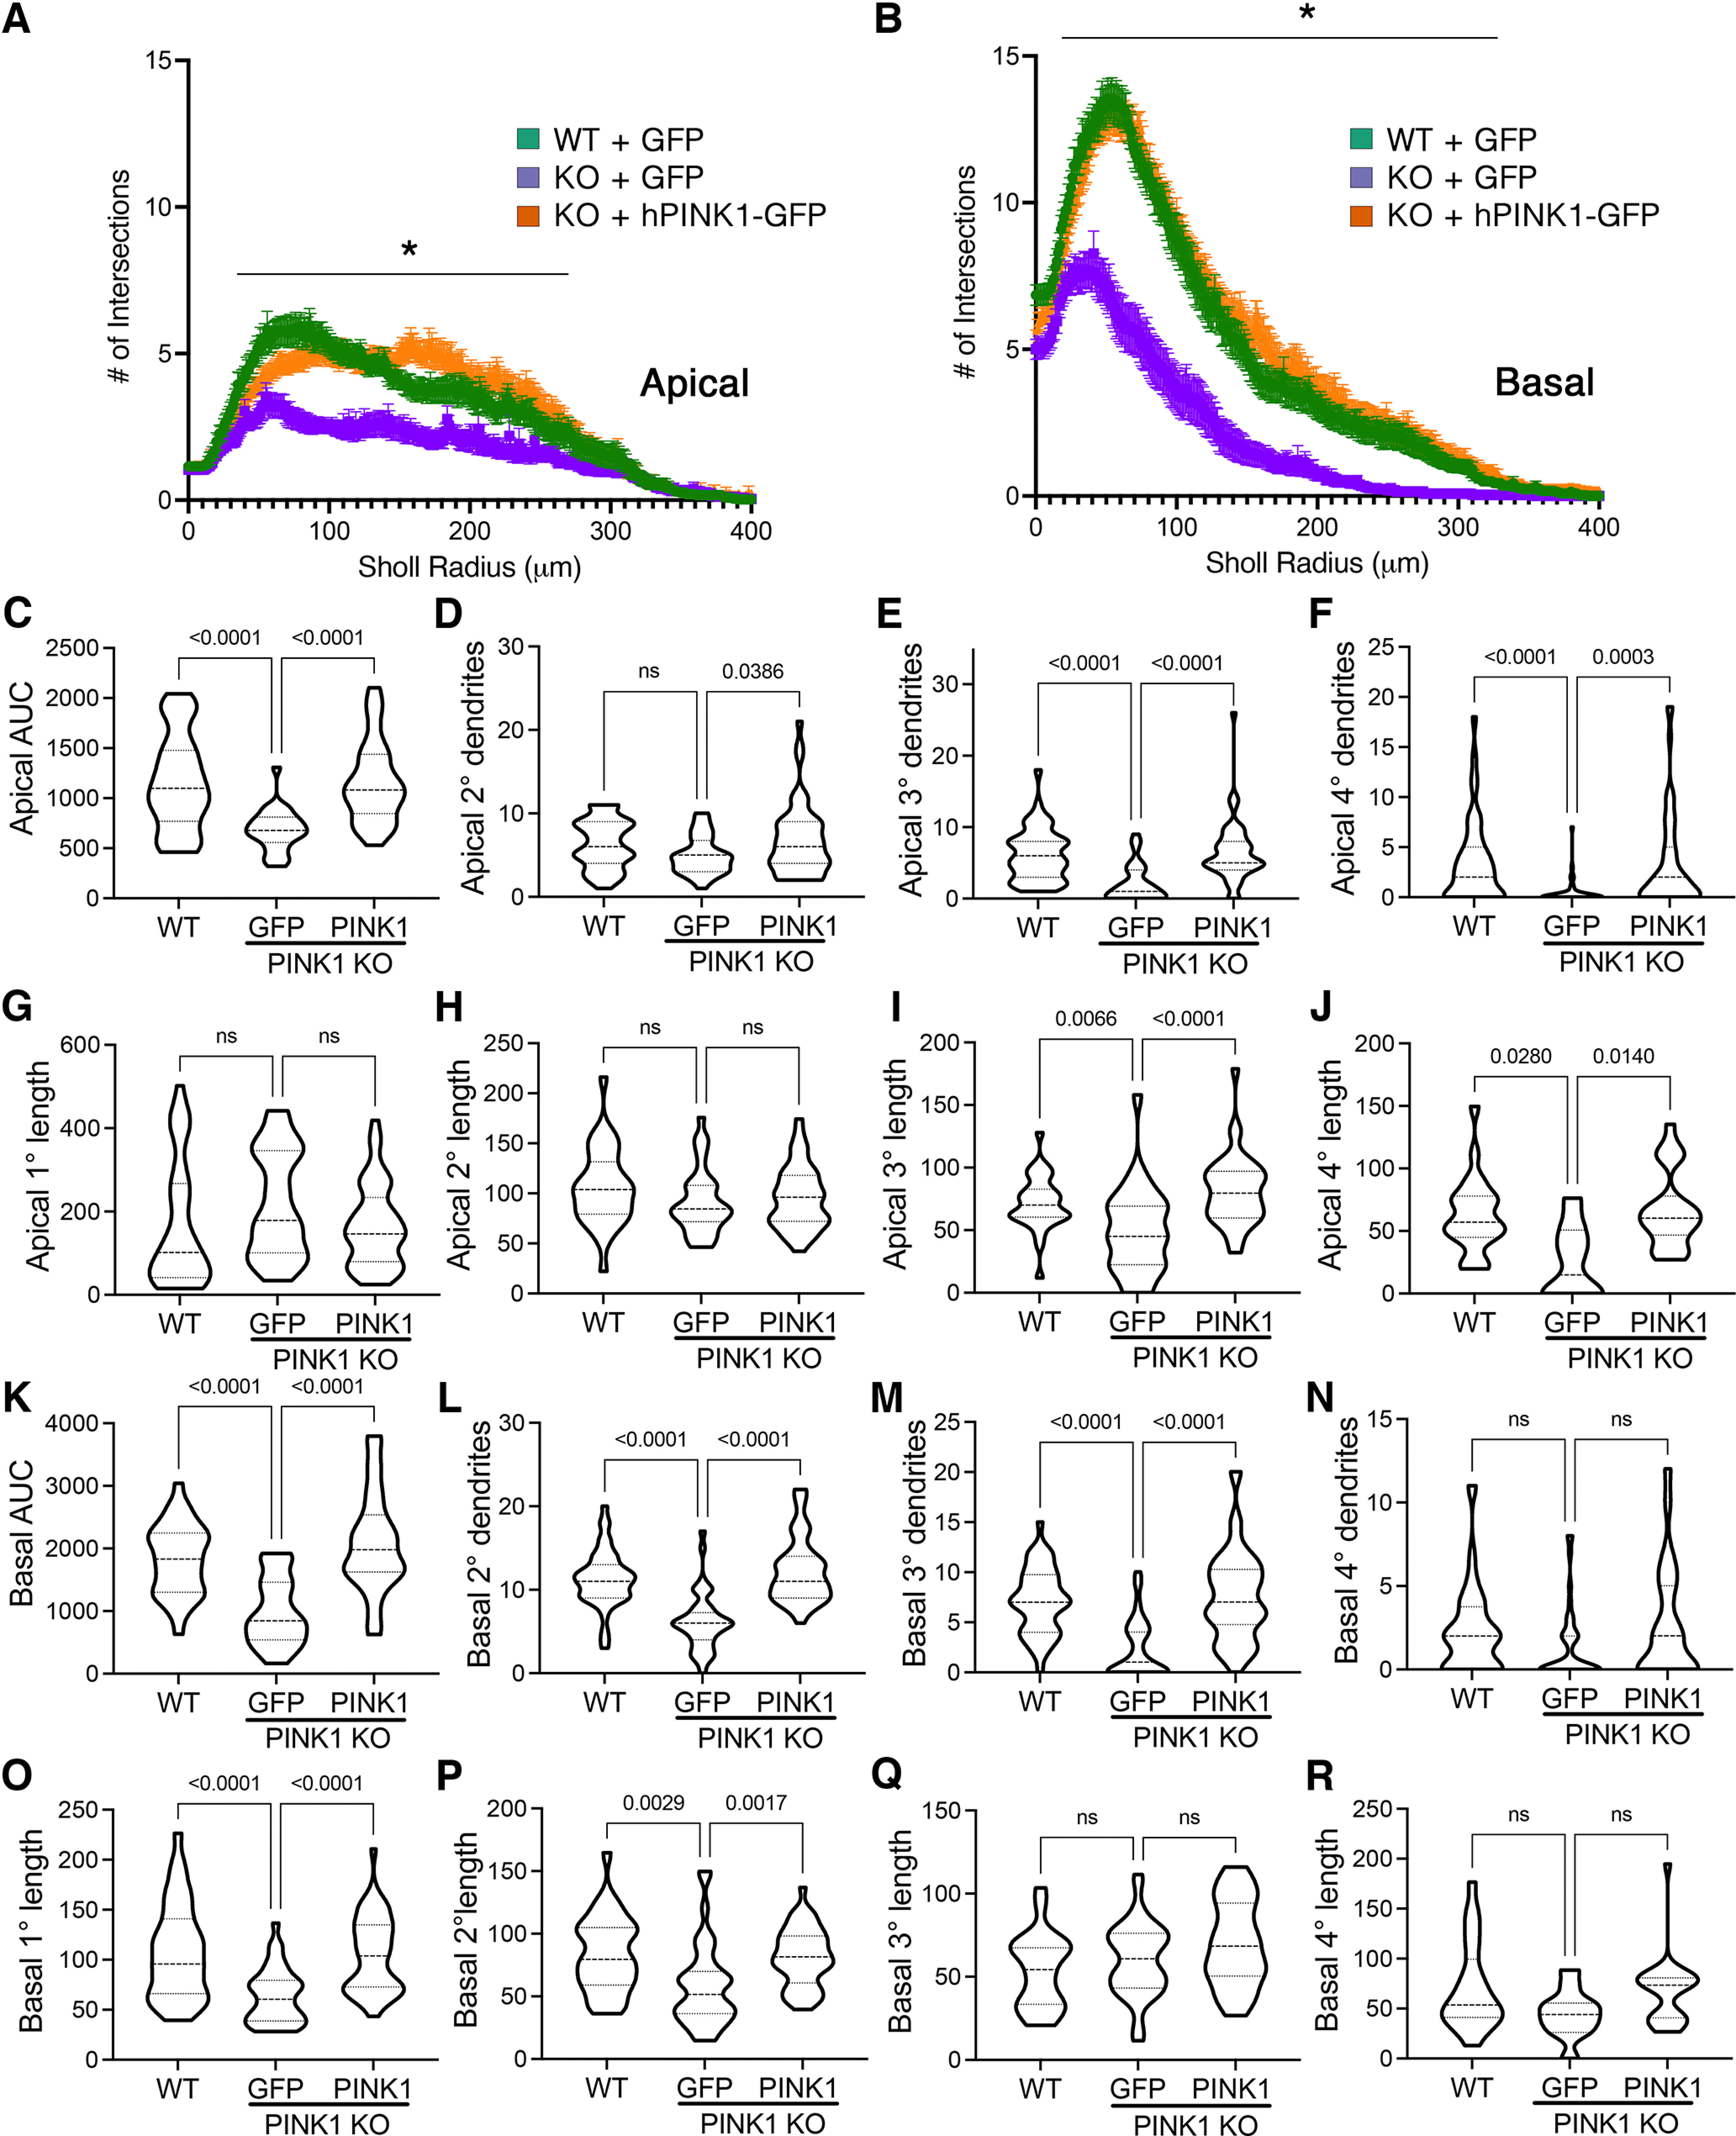
Loss of PINK1 shows greater effects on higher-order apical dendrites and 2°/3° basal dendrites. A, B, Sholl curves for apical (A) and basal (B) dendritic arbors of KO mouse cortical neurons compared with WT neurons and following rescue with human PINK1. Mean ± SEM; *radii with significant differences for KO versus WT, KO versus KO + hPINK1 (multiple-comparison testing following two-way repeated-measures ANOVA; Table 2). C, AUC analysis for apical dendrites. D–F, The number of secondary, tertiary, and quaternary branches off the apical dendrite per neuron. G–J, The average branch lengths of primary, secondary, tertiary, and quaternary apical dendrites per neuron. K, AUC analysis for basal dendrites. L–N, The number of secondary, tertiary, and quaternary basilar dendrites per neuron. O–R, The average basilar branch lengths for primary, secondary, tertiary, and quaternary dendrites. Data are expressed as violin plot probability densities with the median and interquartile range indicated. Adjusted p values following post hoc Dunnett's T3 multiple comparisons test are shown (n = 25–52 neurons per condition compiled from three to four independent experiments; Table 2). ns - not significant.