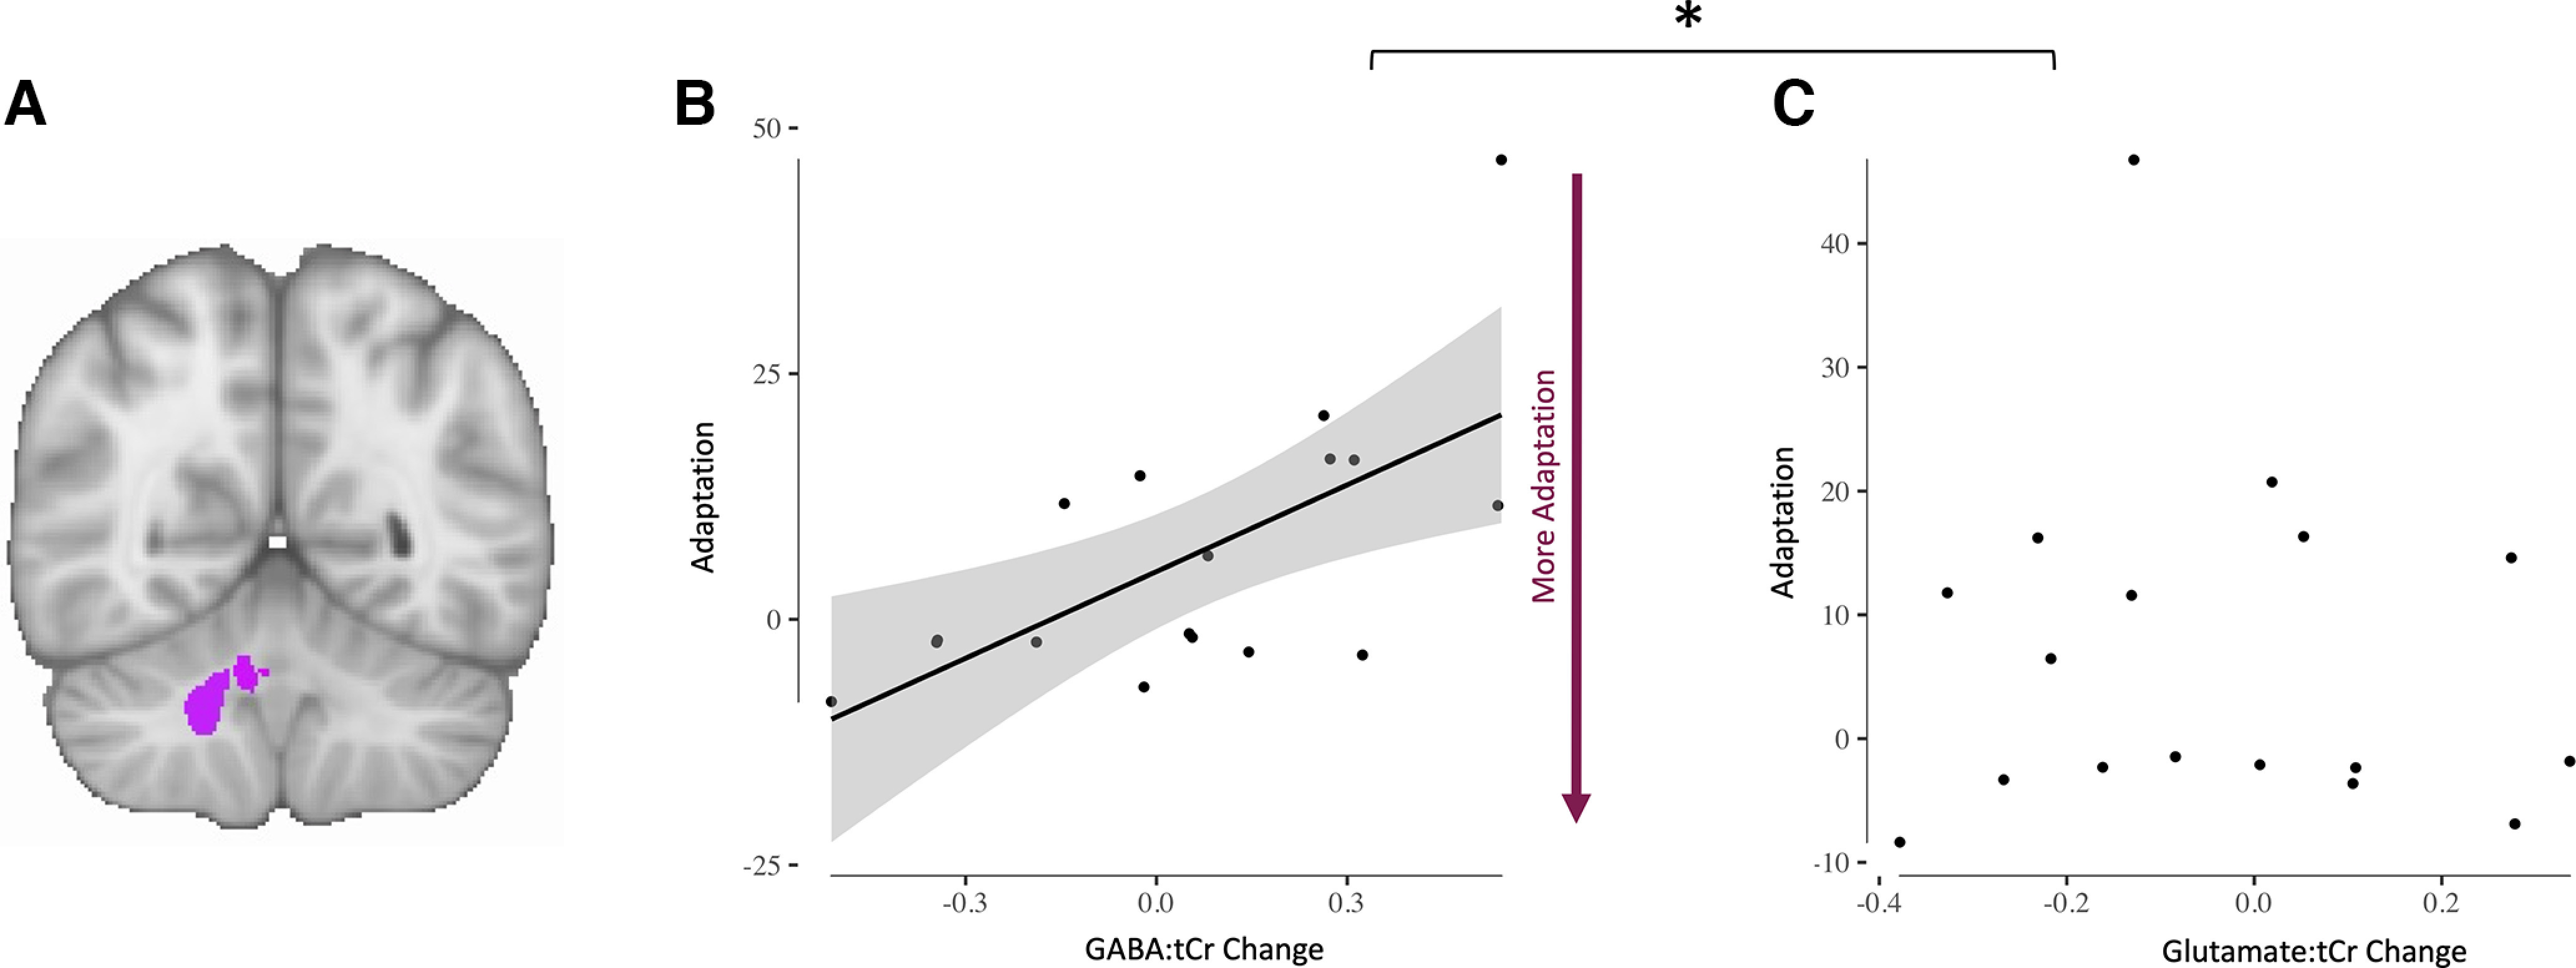
Figure 4.

Adaptation-driven early GABA change correlates with adaptation. A, Right cerebellar nuclei ROI. B, GABA change in right cerebellar nuclei correlates with adaptation (r = 0.64, p = 0.006). Each dot represents one participant. Shading indicates 95% confidence bounds of the relationship. C, Glutamate change in right cerebellar nuclei does not correlate with adaptation (r = −0.10, p = 0.693). Each dot represents one participant. Line of best fit is not plotted for this correlation because the correlation is not significant. The asterisk (*) Indicates that the relationships were significantly different (GABA change vs glutamate change relationship; zdiff = 2.27, p = 0.011).
