Figure 1.
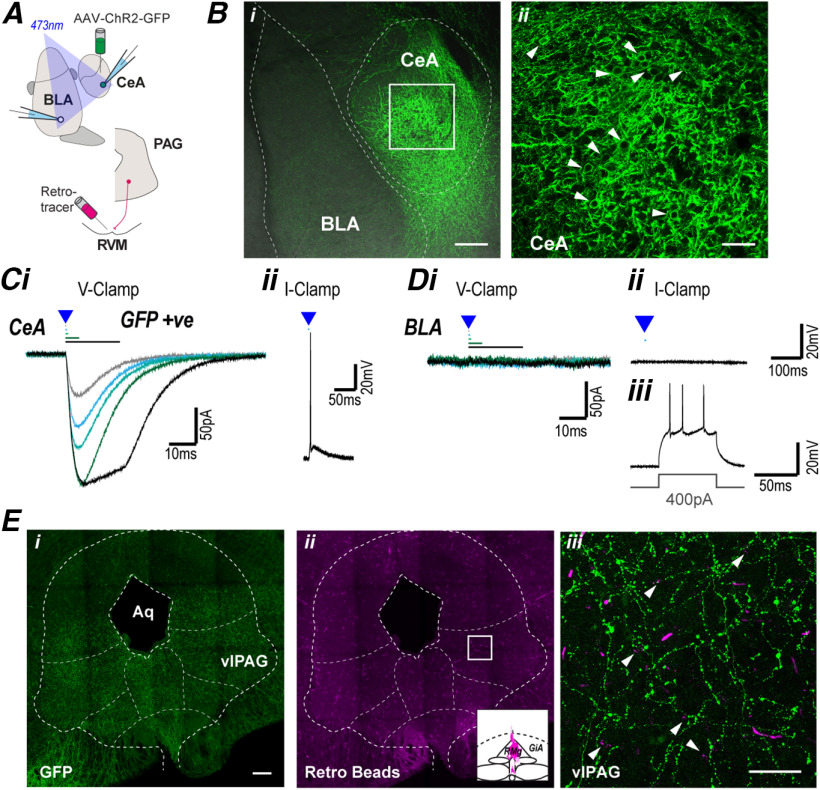
The CeA projects to the midbrain PAG. A, Schematic of experimental configuration; optically evoked currents were recorded in CeA and BLA neurons from animals which received intra-CeA AAV-ChR2 injection, and in some cases an intra-RVM retrograde tracer injection. Bi, Low-power (10×), stacked image (z = 52 µm) displaying AAV-ChR2 injection site; 488 and BF channels overlaid to illustrate different amygdala regions. Bii, High-power (40×), stacked image (z = 4 µm) of ROI illustrated in Bi, arrows indicate cell surface labeling of AAV-ChR2-GFP. C, Single traces of (i) currents in CeA neurons evoked by focal optical stimulation of increasing duration (0.2, 0.5, 1, 5, and 20 ms) in voltage-clamp mode, and (ii) optically evoked action potential in current-clamp mode. D, Single traces of (i) currents in BLA neurons evoked by focal optical stimulation of increasing duration (0.2, 0.5, 1, 5, and 20 ms) in voltage-clamp mode, and (ii, iii) in current-clamp mode showing action potential generation during a current step, but not during optical stimulation. Ei, Eii, Low-power (20×), tiled (4 × 4) stacked image (z = 38 µm), showing distribution of (i) AAV-ChR2-GFP terminal labeling and (ii) retrolabeling, inset displays injection location in RVM. Eiii, High-power (63×), stacked image (z = 26 µm) of ROI illustrated in Eii, arrows indicate retrograde beads surrounded by terminal AAV-ChR2-GFP labeling. Scale bars: 200 µm (Bi, Ei, Eii) and 50 µm (Bii, Eiii).

