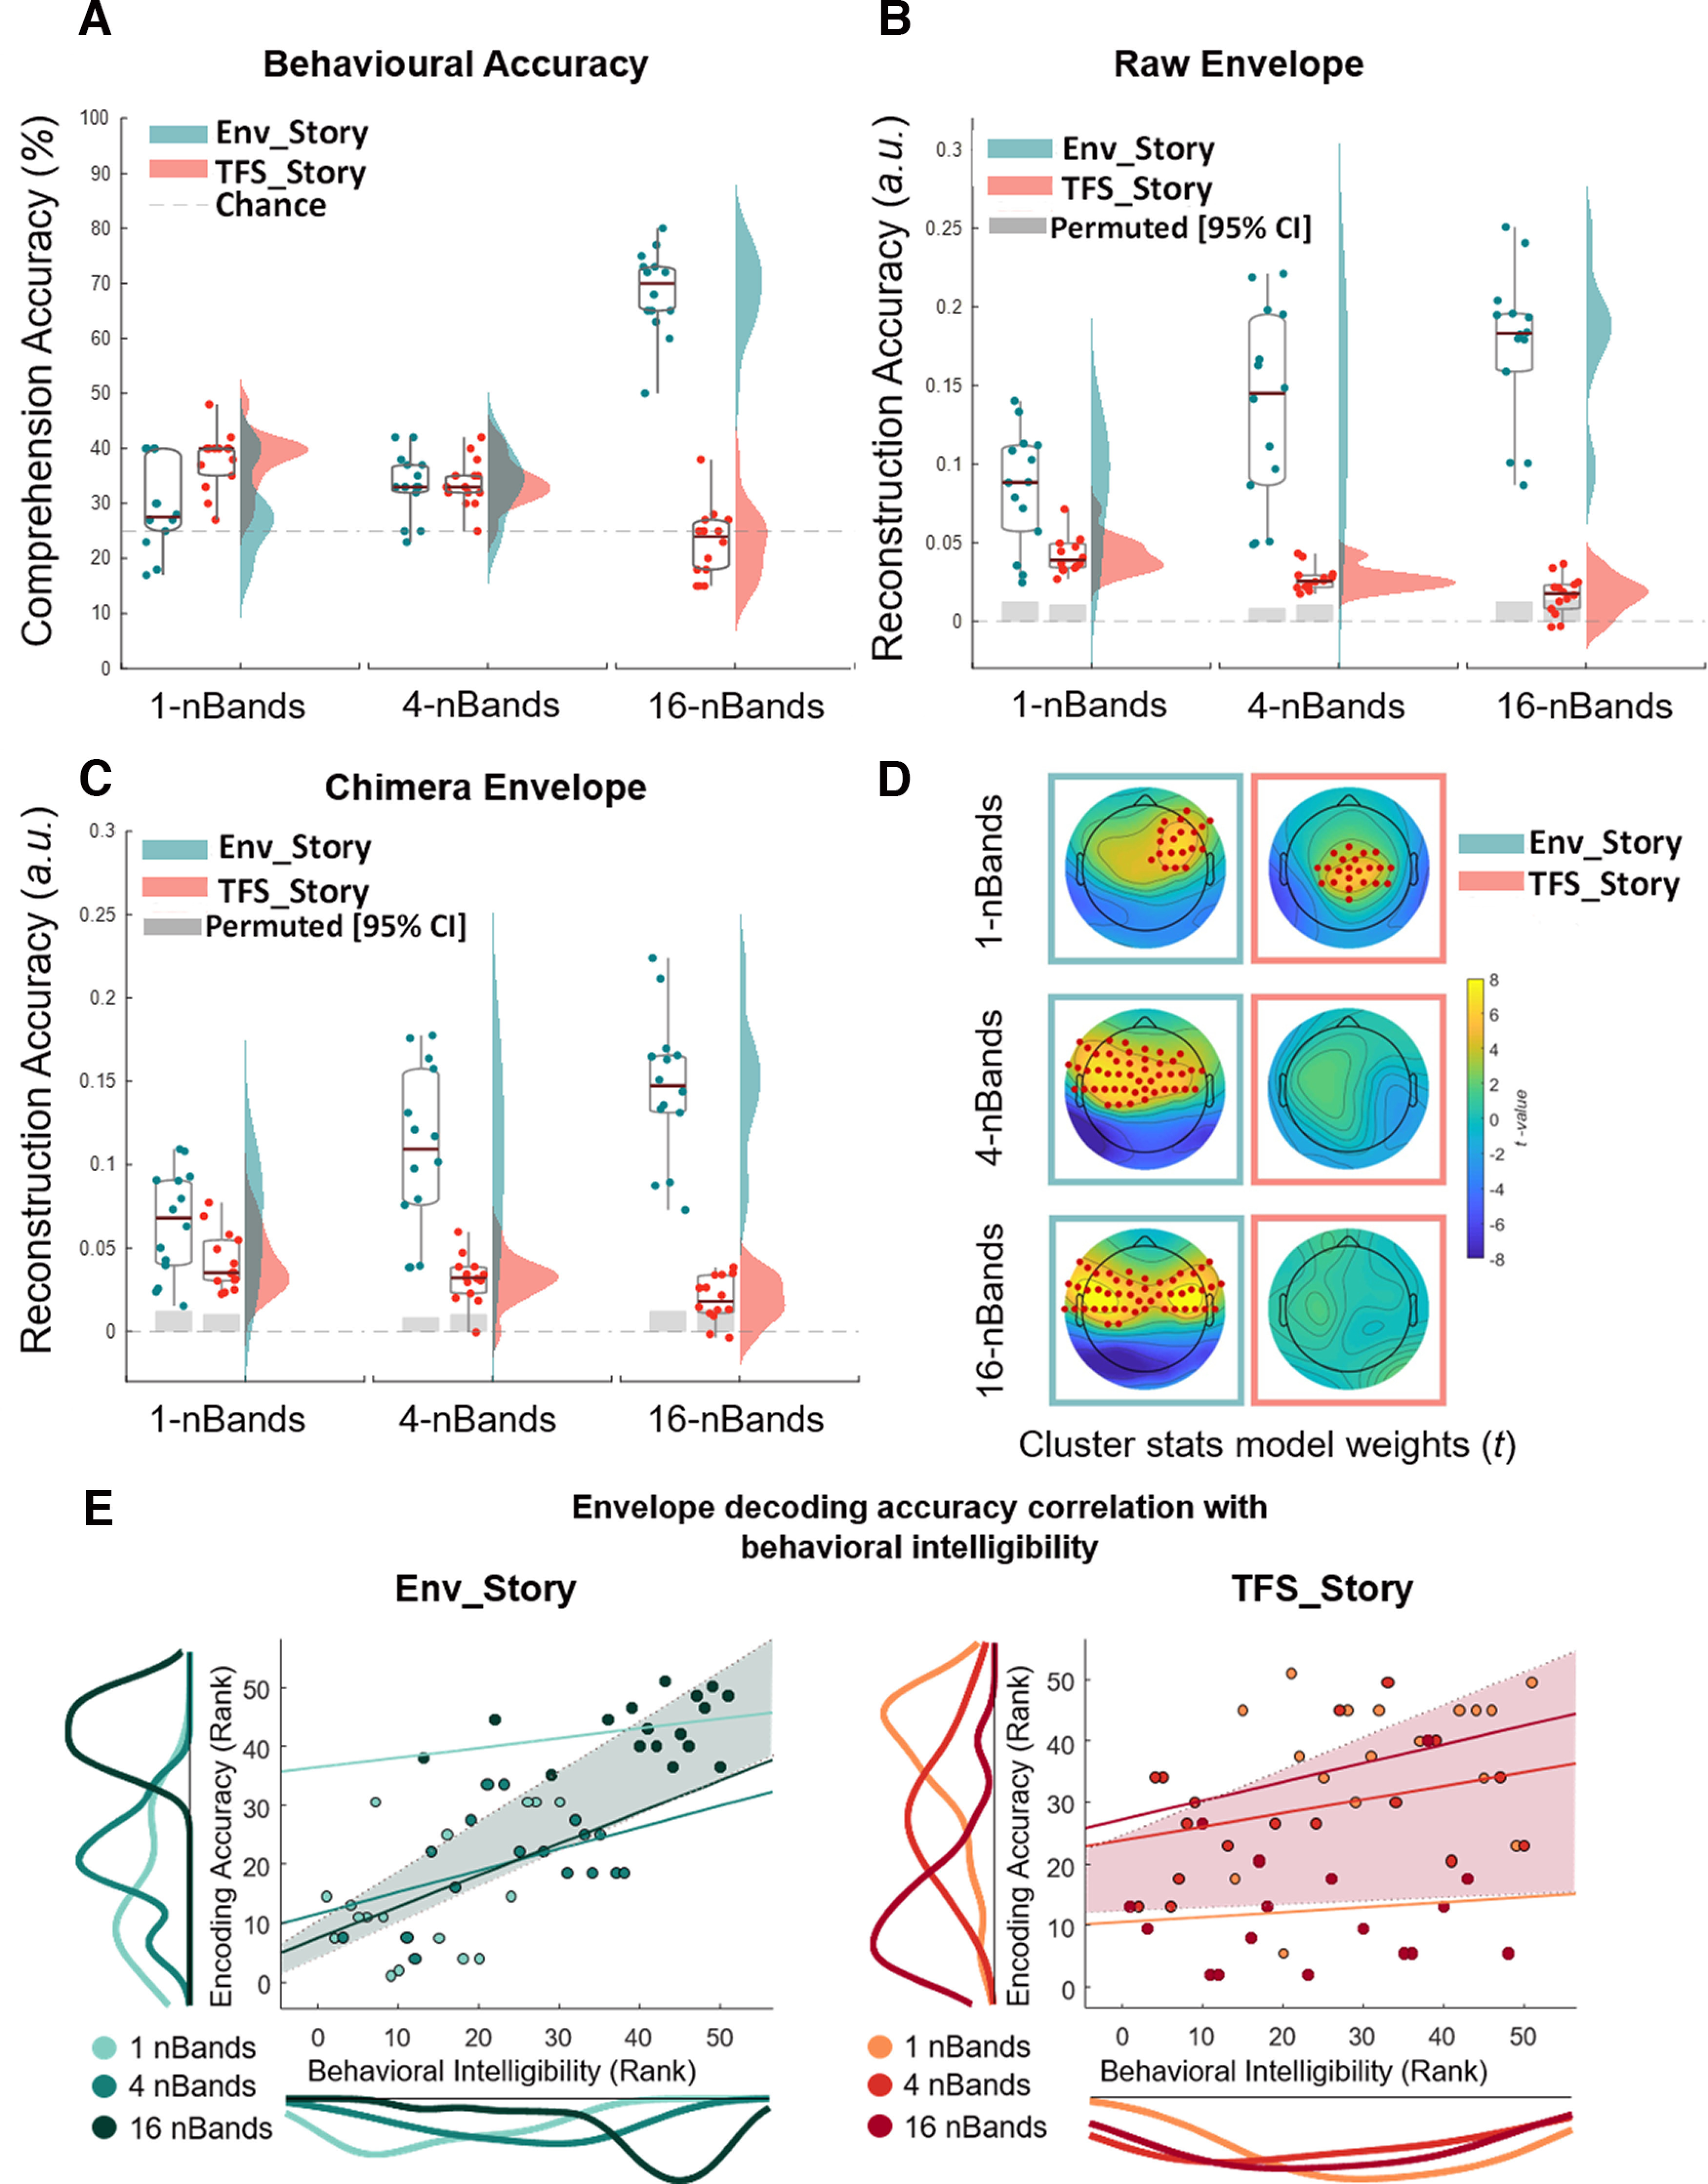
Figure 3.

Cortical tracking of speech envelopes reflects both acoustics and speech intelligibility across chimera conditions. A–C, Box plots (mean ± SEM) and rain kernel density estimates of speech intelligibility and reconstruction decoding accuracy (Rho) values for Env_Story (turquoise) and TFS_Story (peach). Group and individual statistics; black line in box plot indicates mean across subjects, and gray box demarcates single-subject-level statistical significance above chance (permutation test based on shuffling trial labels 1000 times before reconstructing the envelopes, *p< 0.05). Single dots represent single-subject data. Behavioral intelligibility (A), original envelope reconstruction accuracies (B), and chimera envelope reconstruction accuracies across bands, conditions, and stories (C). D, Topographical plots show forward transformed decoder weights across all channels for Env_Story and TFS_Story over a time-lag window of 80–120 ms. Red dots indicate significant effects at the group level (one-tailed cluster-based permutation test, N = 2000, p< 0.05). E, Left, Env_Story; right. TFS_Story brain-behavior correlations. Individual dots represent subjects and are color coded according to condition. Correlations were assessed using robust Pearson's correlation (bootstrap permutation test p< 0.05). This was done for each individual condition (colored lines), as well as collapsed across all conditions (shaded area representing 95% confidence interval). Subplots show the distribution of the data in terms of both envelope decoding (left) and behavior (below) using the same color code as the subject dots.
