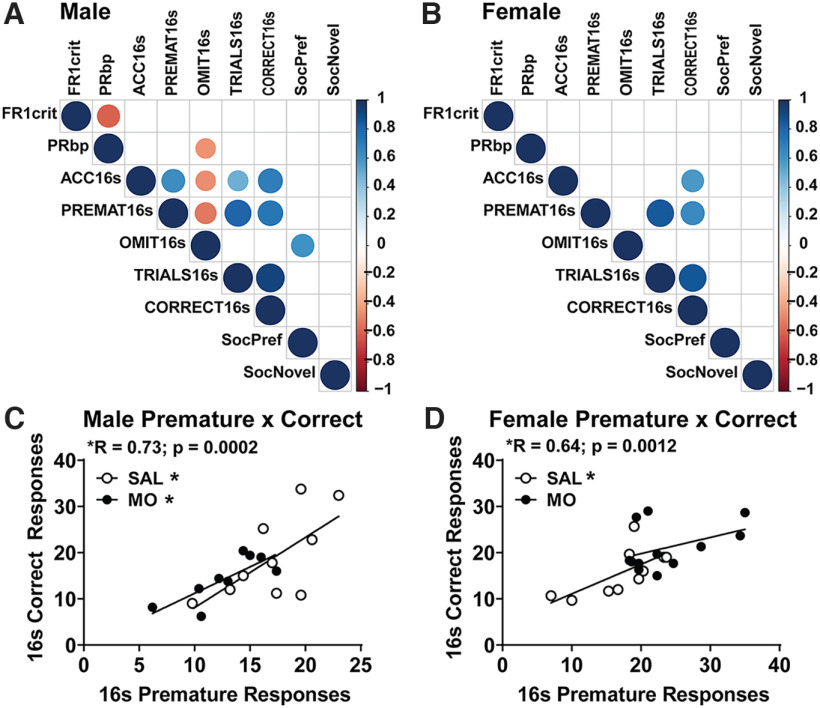
Figure 4.
Behavioral correlations. A, B, Male (A) and female (B) correlation plots with circles denoting significant p-values (larger circle size showing smaller p-value) and the color of the circle showing the Pearson r value. C, D, Male (C) and female (D) linear regression plots depicting the correlation between premature and correct responses, further divided by MO versus SAL (*p < 0.05 via Pearson correlation). FR1 crit, Days to reach FR1 criterion; PRbp, break point in progressive ratio; ACC16s, average percentage accuracy (ACC) across initial 5CSRTT training with 16 s stimulus (16 s); PREMAT16s, average premature responses (16 s); OMIT16s, average percentage omissions (16 s); TRIALS16s, average trials (16s); CORRECT16s, average number of correct trials (16 s); SocPref, percentage preference for mouse versus empty cup in three-chamber social interaction test; SocNovel, percentage preference for novel versus familiar mouse in three-chamber social interaction test.

