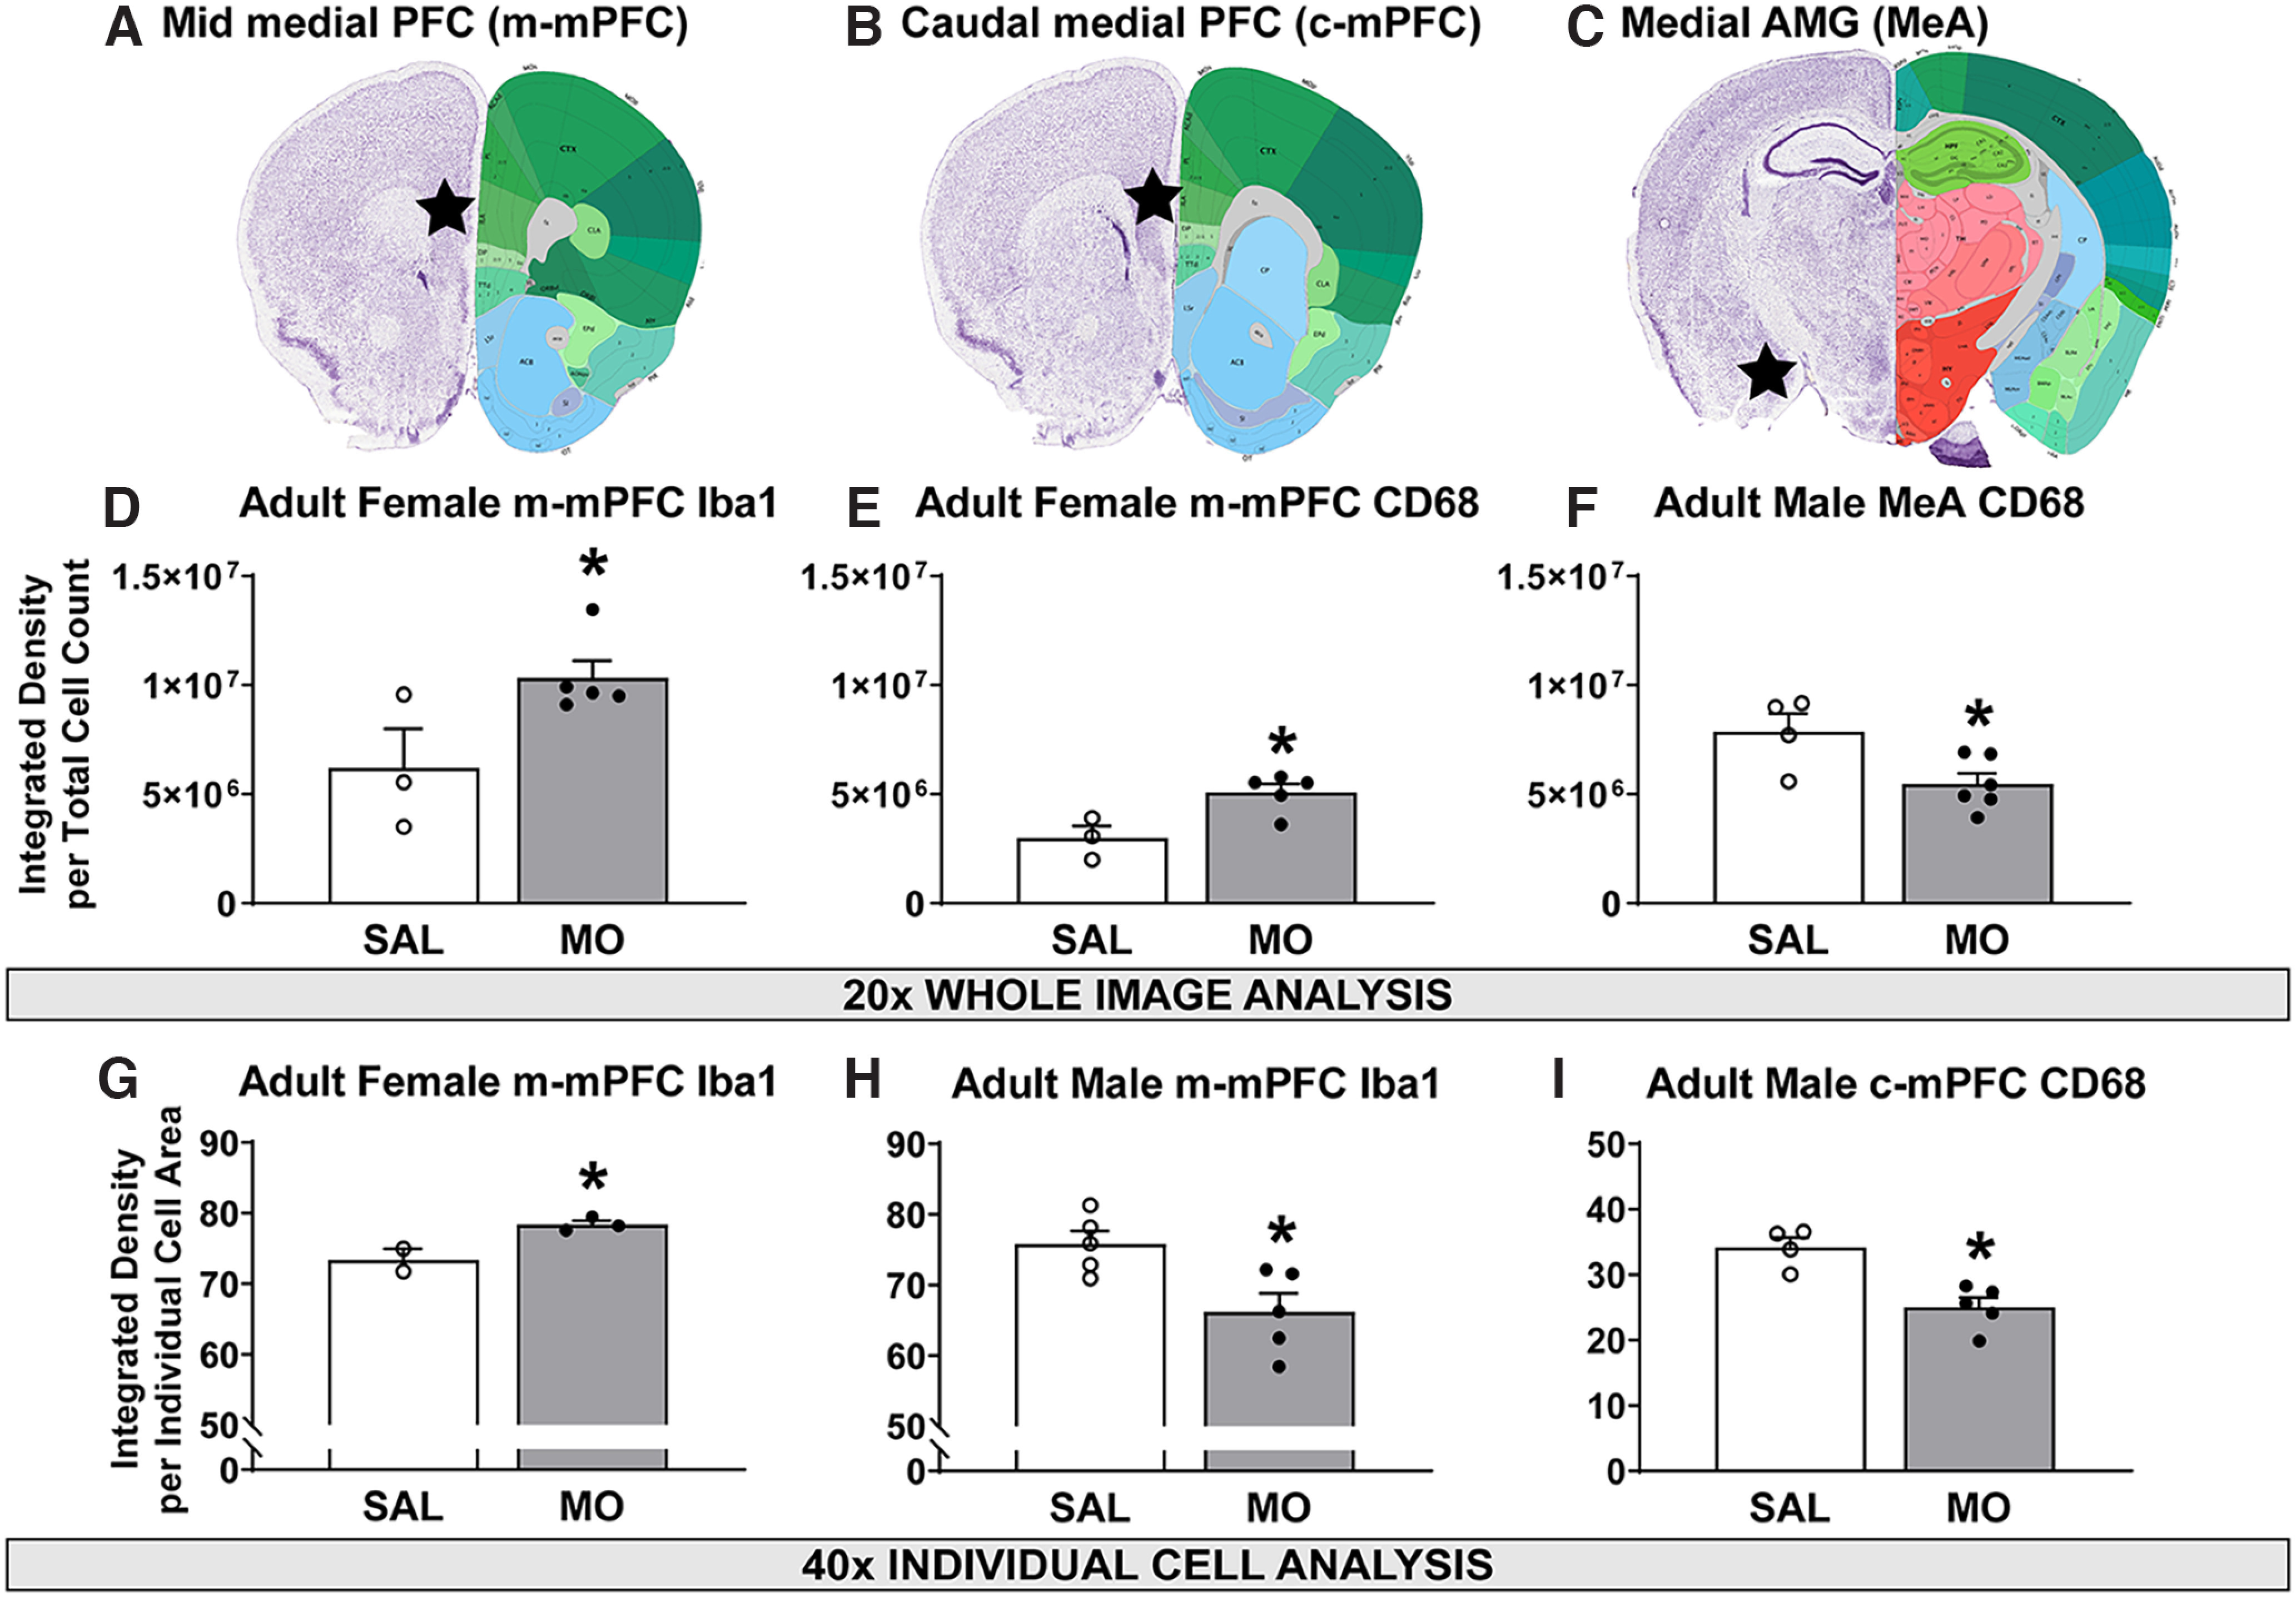
Figure 6.

Adult Iba1 and CD68 immunohistochemistry. A–C, Anatomical description of the m-mPFC (A), c-mPFC (B), and MeA (C). D, E, In 20× m-mPFC images, female MO offspring had increased Iba1 (D) and CD68 (E) integrated density normalized to cell count. F, In 20× MeA images, male MO offspring had reduced CD68 integrated density normalized to cell count. G, In 40× m-mPFC images, female MO offspring had increased Iba1 integrated density within the cell body. H, I, In 40× PFC images, male MO offspring had reduced Iba1 (H) and reduced CD68 integrated densities (I) within the cell body in the m-mPFC and c-mPFC, respectively. *p < 0.05 versus SAL, t test. Extended Data Figure 6-1 shows male m-mPFC values, and Extended Data Figure 6-2 shows representative immunohistochemical images.
