Figure 1.

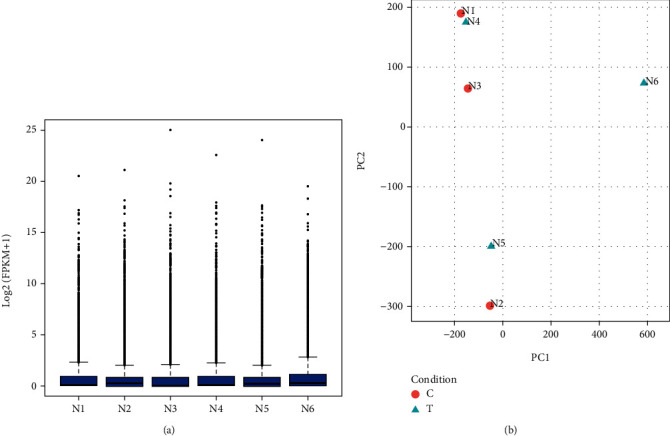
Transcript expression abundance and PCA plot of samples. (a) Boxplot of known transcript expression abundance; (b) PCA plot of the sample.

Transcript expression abundance and PCA plot of samples. (a) Boxplot of known transcript expression abundance; (b) PCA plot of the sample.