Figure 13.

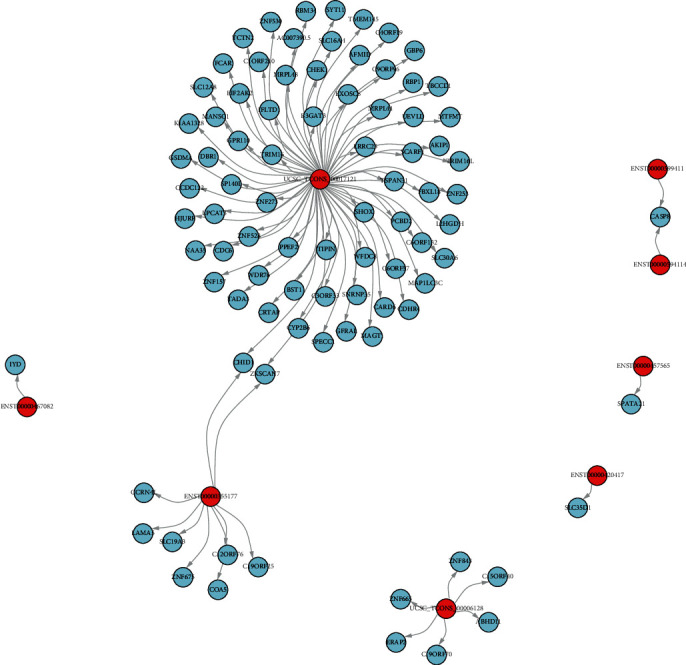
The trans-regulated target gene network diagram of differentially expressed lncRNAs. Red represented lncRNA and blue the represented target gene.

The trans-regulated target gene network diagram of differentially expressed lncRNAs. Red represented lncRNA and blue the represented target gene.