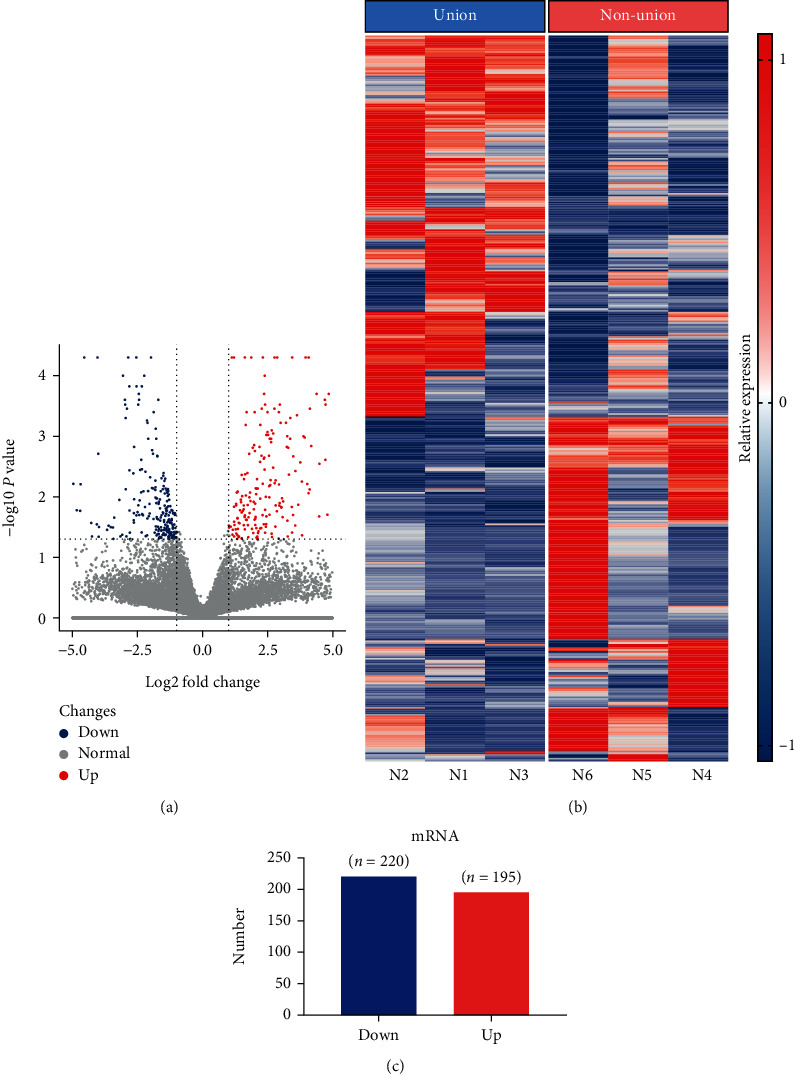
Figure 3.

Differential expression of genes (DEGs) between bone nonunion and union tissues. (a) Volcano plot showing DEGs; (b) 415 DELs between bone nonunion and union group comprising 220 downregulated genes and 195 upregulated genes; (c) heatmap of DEGs. T1, T2, and T3: bone union group; T4, T5, and T6: bone nonunion group.
