Figure 6.

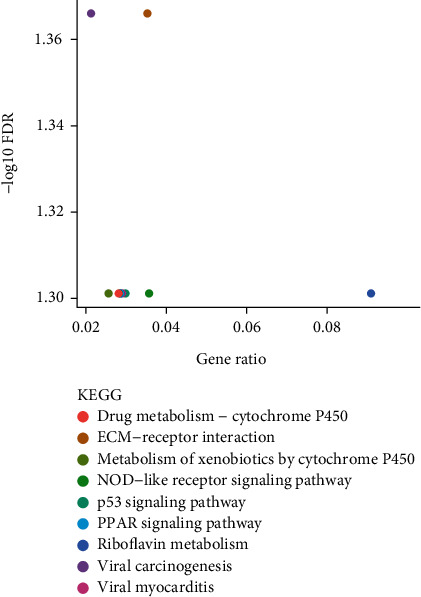
KEGG analysis of the potential pathway enriched by DELs; the abscissa represented the gene ratio and the ordinate represented the −log10 FDR value.

KEGG analysis of the potential pathway enriched by DELs; the abscissa represented the gene ratio and the ordinate represented the −log10 FDR value.