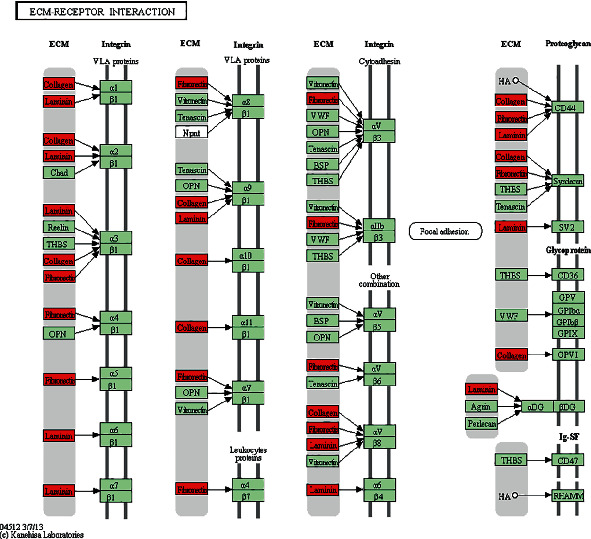
Figure 8.

KEGG pathway of ECM-receptor interaction. Red indicated significantly different expression genes in the bone nonunion group compared with bone union group. Organism-specific genes or pathways were colored green.

KEGG pathway of ECM-receptor interaction. Red indicated significantly different expression genes in the bone nonunion group compared with bone union group. Organism-specific genes or pathways were colored green.