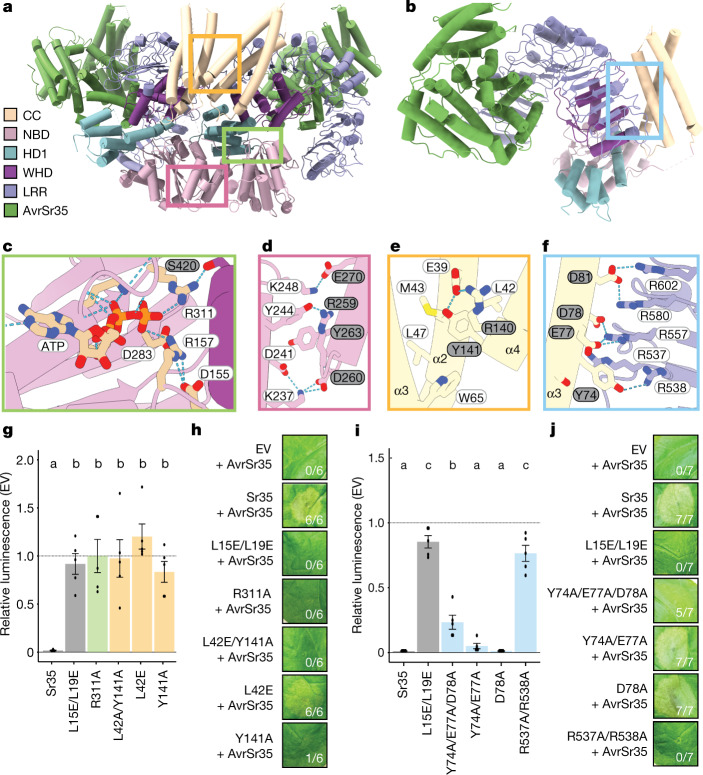
Fig. 2. Assembly of the Sr35 resistosome.
a, Sr35 resistosome showing a lateral dimer. Boxes in green, yellow and pink indicate positions of the zoomed views in c–f. Sr35 domains and AvrSr35 coloured according to the inset panel. b, Structure of one Sr35 protomer in complex with AvrSr35. Colour codes as in a. The blue box indicates position of structural detail in f. c, Structural detail of ATP binding in one protomer. Note the specific hydrogen bond of R311 with the γ-phosphate group of ATP at a 2.8 Å distance. Grey and white residue labels correspond to NBD and WHD residues, respectively. d, Structural detail of the interface between NBDs of a lateral dimer. Dashed lines represent polar interactions. Grey and white residue labels correspond to two neighbouring protomers from the pentamer. e, Structural detail of interface between two coiled-coil (CC) protomers. f, Structural detail of coiled-coil and LRR domain intramolecular packing in one Sr35 protomer. Acidic residues in the CCEDIVD form salt-bridges with basic Arg (R) residues of the LRRR-cluster. g, Cotransfection of Sr35 and Sr35 mutants with AvrSr35 in wheat protoplasts. Relative luminescence as readout for cell death. EV treatment defined the relative baseline (mean ± s.e.m.; n = 5). Test statistics derived from analysis of variance (ANOVA) and Tukey post hoc tests (P < 0.05). Exact P values for all protoplast plots are provided in Supplementary Table 3. Bar colours as box colours in c and d. h, Tobacco cell death data of Sr35 and Sr35 mutants with AvrSr35. i, Wheat protoplast data of EDIVD and R-cluster mutants. Experiment and statistics as in g. Bar colours as box colour in f. j, Nicotiana benthamiana cell death data of EDVID and R-cluster mutants. Representative data in h and j shown from seven replicates and scored for leaf cell death.

