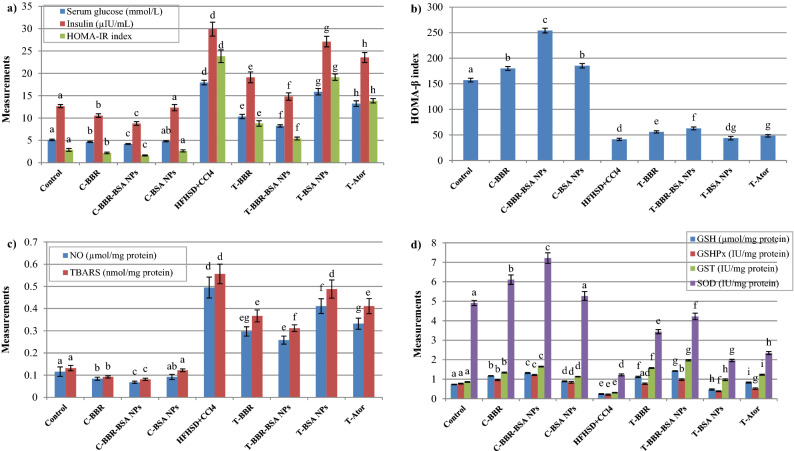
Figure 6.
The effect of BBR and BBR-BSA NPs on the stressed pancreatic rat model. Serum glucose, insulin, and HOMA-IR index levels (a); Serum HOMA-β index (b); Pancreatic NO and TBARS levels (c); Pancreatic GSH level, GSHPx, GST, and SOD activities (d). Data values are expressed as means ± SD (n = 5). Different letters indicated statistically significant differences (P < 0.05) between the experimental groups within the same parameter, which were evaluated using the analysis of one-way ANOVA with the post hoc LSD test.

