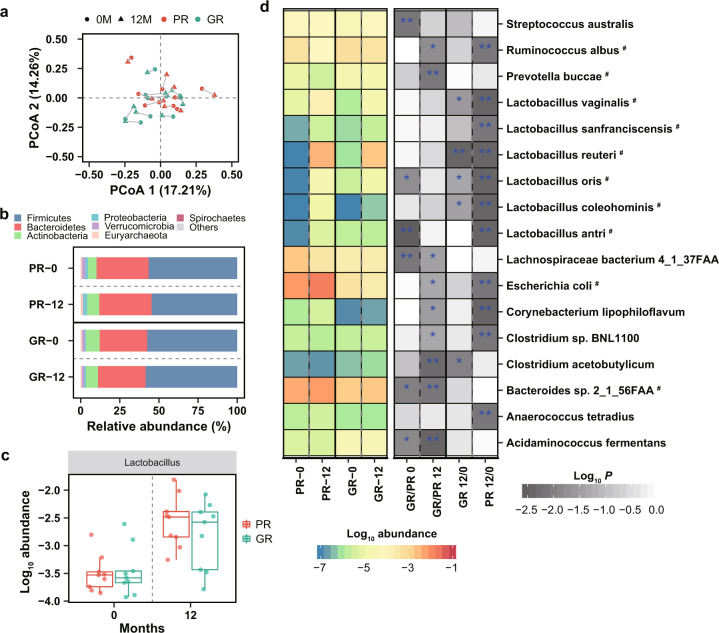
Fig. 2. Compositional differences of the gut microbiota after supplementation with L. reuteri ATCC PTA 6475.
a Principal coordinate analysis (PCoA) of microbiota community at species level based on Bray–Curtis distance. The overall microbial composition between the GR (n = 9) and PR (n = 9) groups or between the two time points shows no significant difference, estimated by PERMANOVA analysis. The blue and red colors indicate the GR and PR groups, respectively; The dot and triangle indicate the baseline (0 M) and 12 months (12 M), respectively. b Relative profiles of top seven abundant phyla. c Increased abundance of the genus Lactobacillusin in the GR (n = 9) and PR (n = 9) groups at 12 months (P-value < 0.01 by the Wilcoxon signed-rank test). The upper quartile, median and lower quartile are shown in the box plot. The blue and red colors indicate the GR and PR groups, respectively. d The left heatmap shows log-transformed mean abundances of differential species in the two groups at the two time points. The blue and red colors indicate the low and high abundances, respectively; The grey color in the right heatmap indicates P-value of comparative analysis using the Wilcoxon test; ‘*’ denotes P < 0.05; ‘**’ denotes P < 0.01; ‘#’ indicates the differential species were also identified by DESeq2 (adjusted P-value < 0.05 and |log2 fold change | >1.

