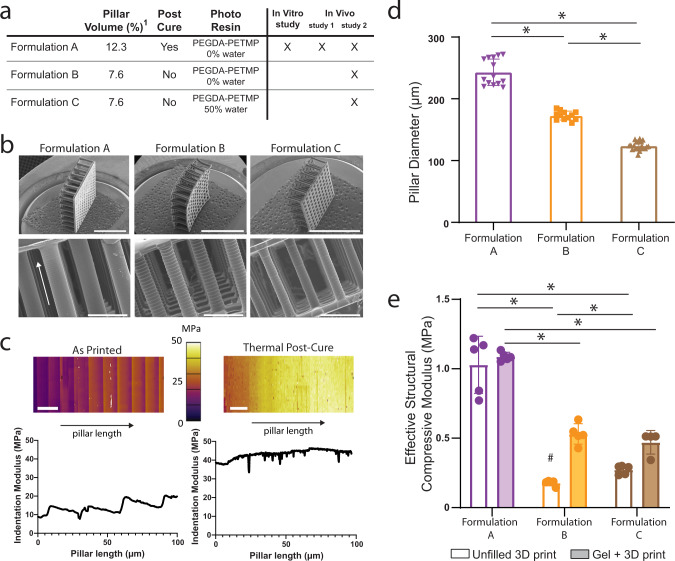
Fig. 3. Characterization of the different gel + 3D print formulations used in this study.
a Table showing the pillar volume (1pillar volume % is based on CAD design), post-cure conditions, and photo resin used for the 3D print for each formulation. b SEM images of all three scaffold designs. Scale bar on top row of images is 3 mm and higher-resolution images (bottom row) scale bar represents 500 μm. (arrow represents pillar length). c 3D printed structure evaluated via AFM showing fluctuations in mechanical properties down the length of the pillar due to printing process (left, as printed) and the improved mechanical properties and reduction in variance after thermal post-cure process (right, thermal post-cure). Scale bars represent 20 µm. d Pillar diameter measured via SEM showing all three formulations have significantly different pillar diameters once printed. * denotes significant differences (p < 0.05; Kruskal–Wallis test). e Effective structural compressive modulus of the unfilled 3D print and gel + 3D print composite using Formulation A, Formulation B, and Formulation C (unfilled 3D print represented with empty fill bars, Gel + 3D print represented with solid fill bars). Results show Formulation A was significantly different than Formulation B and C, but no differences in compressive modulus were seen between Formulations B and C when filled with the cartilage mimetic hydrogel. *denotes significant differences (p < 0.05; one-way ANOVA, Tukey’s HSD post hoc) between formulations, and # denotes significant difference (p < 0.05; t-test) between the filled and unfilled 3D print. Data represent mean ± standard deviation (error bars).

