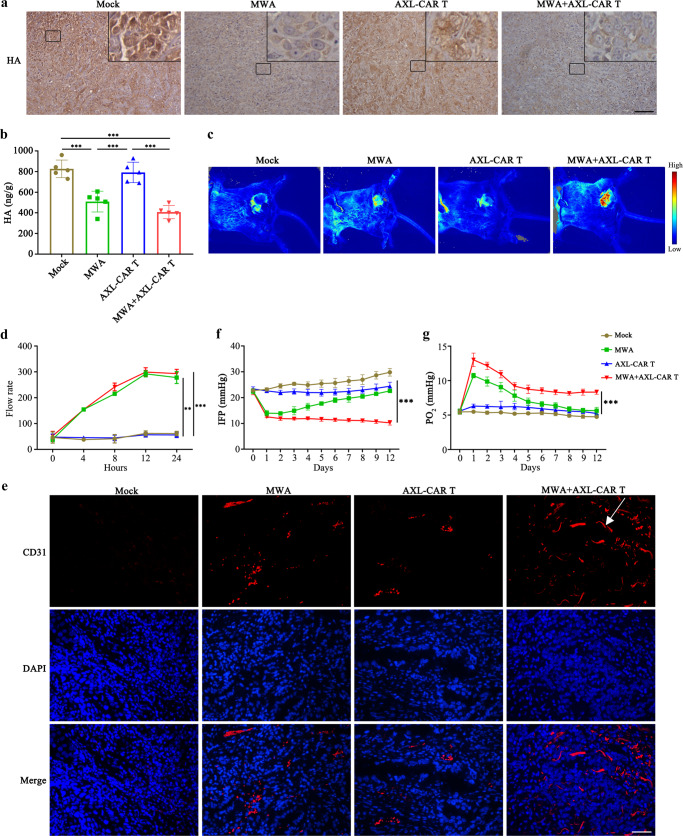
Fig. 5. TME remodelling following MWA in NSCLC PDX tumours.
a, b HA detection in different groups on day 33 by IHC (magnification ×200) and ELISA, respectively. Scale bar: 100 µm. Representative staining image fields with similar results are shown. Data are presented as the mean ± SD over 5 biologically independent samples per group and analysed by one-way ANOVA with Tukey’s multiple comparisons test (b: Mock vs MWA p = 0.0002, Mock/AXL-CAR T vs MWA+AXL-CAR T p < 0.0001, MWA vs AXL-CAR T p = 0.0006). c, d Representative blood flow rate images (each group n = 3) and curve around the tumour region at 0, 4, 8, 12, and 24 h after MWA treatment by laser speckle equipment (d: MWA vs Mock p = 0.004, MWA vs AXL-CAR T p = 0.003, MWA+AXL-CAR T vs Mock p = 0.0007, MWA + AXL CAR T vs AXL-CAR T p = 0.0005). e Immunofluorescence staining of blood vessels (CD31) in tumour tissues collected from mice after treatment on day 42 (magnification ×200). Representative staining image fields with similar results are shown (n = 5 per group). Scale bar: 100 µm. f, g IFP and PO2 measurements in mice before and after the treatment (Mock/MWA/AXL-CAR T vs MWA+AXL-CAR T p < 0.0001). Data are presented as the mean ± SD (n = 3 mice per group) and analysed by two-way ANOVA with Tukey’s multiple comparisons test (d, f, g). *p < 0.05, **p < 0.01, ***p < 0.001. Source data are provided as a Source Data file.

