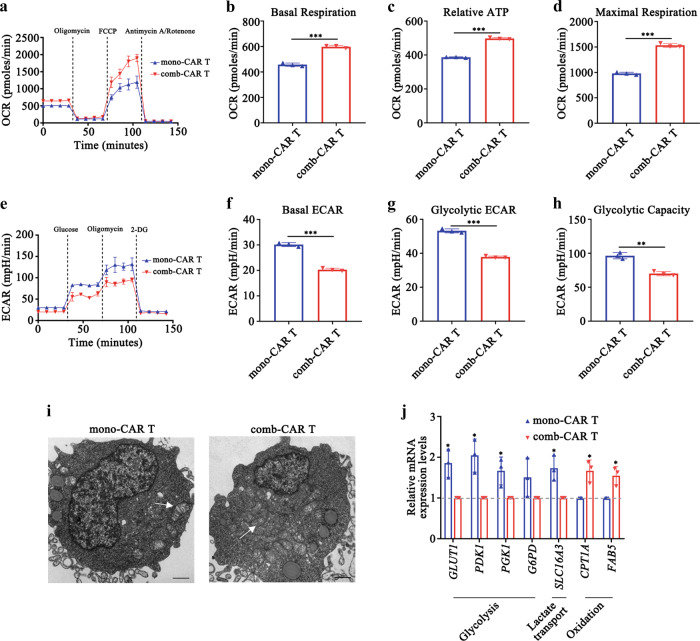
Fig. 7. MWA reprograms AXL-CAR T cell metabolism.
a–d Representative oxygen consumption rate (OCR) curves and mitochondrial stress test quantifications at different metabolic states (b: mono-CAR T vs comb-CAR T p = 0.0001. c, d: mono-CAR T vs comb-CAR T p < 0.0001). e–h Representative extracellular acidification rate (ECAR) curves and glycolysis stress test quantifications at different metabolic states (f, g: mono-CAR T vs comb-CAR T p < 0.0001, h: mono-CAR T vs comb-CAR T p = 0.001). i Transmission electron microscopy of mono- and comb-CAR T cells imaged on day 42, white arrow indicates mitochondrion. Representative image fields with similar results are shown (n = 3 per group). Scale bars represent 1 μm. j Relative mRNA expression levels of genes involved in glycolytic metabolism and lipid oxidation assessed in mono- and comb-CAR T cells (GLUT1, PDK1, SLC16A3, CPT1A, FAB5: mono-CAR T vs comb-CAR T p = 0.01, PGK1: mono-CAR T vs comb-CAR T p = 0.03). Data are obtained over 3 biologically independent samples per group and presented as the mean ± SD (a–h, j). Data are analysed by two-sided unpaired t-test (b, d, f–h, j). *p < 0.05, **p < 0.01, ***p < 0.001. Source data are provided as a Source Data file.

