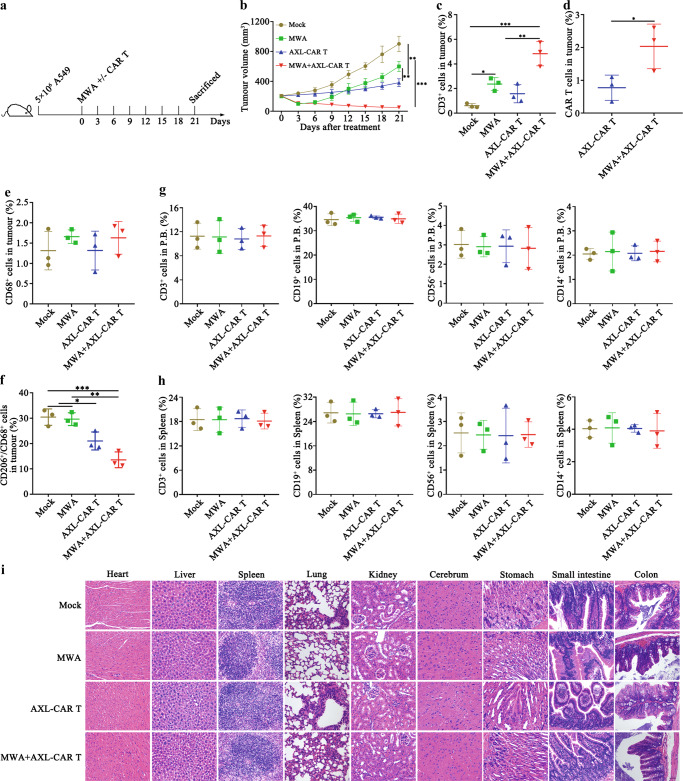
Fig. 8. Antitumour efficacy and safety of MWA+/- AXL-CAR T cells against A549-derived tumour in humanized immunocompetent mice.
a Schematic representation of a combination of MWA and AXL-CAR T cell administration. Briefly, humanized NOG-EXL immunocompetent mice received a subcutaneous injection of 5 × 10⁶ A549 cells in the flank. When tumour volume reached about 200 mm3, mock, MWA+/- AXL-CAR T cells (i.v.) were administrated against A549-bearing mice. b Tumour volume was measured every three days (n = 5 per group). Data are presented as the mean ± SD and analysed by two-way ANOVA with Tukey’s multiple comparisons test (Mock vs MWA p = 0.004, MWA vs AXL-CAR T p = 0.003, Mock VS AXL-CAR T p = 0.0002, Mock vs MWA+AXL-CAR T p = 0.001, MWA vs MWA+AXL-CAR T p < 0.0001, AXL-CAR T vs MWA+AXL-CAR T p = 0.0002). The percentages of total CD3+ T cells (c) and CAR T cells (GFP+) (d). The percentages of total macrophages (e) and M2 macrophages (f) by flow cytometry (c: Mock vs MWA p = 0.049, Mock vs MWA+AXL-CAR T p = 0.0003, MWA vs MWA+AXL-CAR T p = 0.009, AXL-CAR T vs MWA+AXL-CAR T p = 0.002. d: AXL-CAR T vs MWA+AXL-CAR T p = 0.049. f: Mock vs AXL-CAR T p = 0.03, Mock vs MWA+AXL-CAR T p = 0.0008, MWA vs AXL-CAR T p = 0.04, MWA vs MWA+AXL-CAR T p = 0.001). The leukocyte percentage in peripheral blood (g) and spleen (h) was detected by flow cytometry. Data are analysed by one-way ANOVA with Tukey’s multiple comparisons test (c, e–h) and two-sided unpaired t-test (d). i Histopathological analysis of murine organ tissues by haematoxylin and eosin (HE) staining (n = 5 per group, magnification ×200). Scale bar represents 50 μm. Data are obtained over 3 biologically independent samples and presented as the mean ± SD (c–h). *p < 0.05, **p < 0.01, ***p < 0.001. Source data are provided as a Source Data file.

