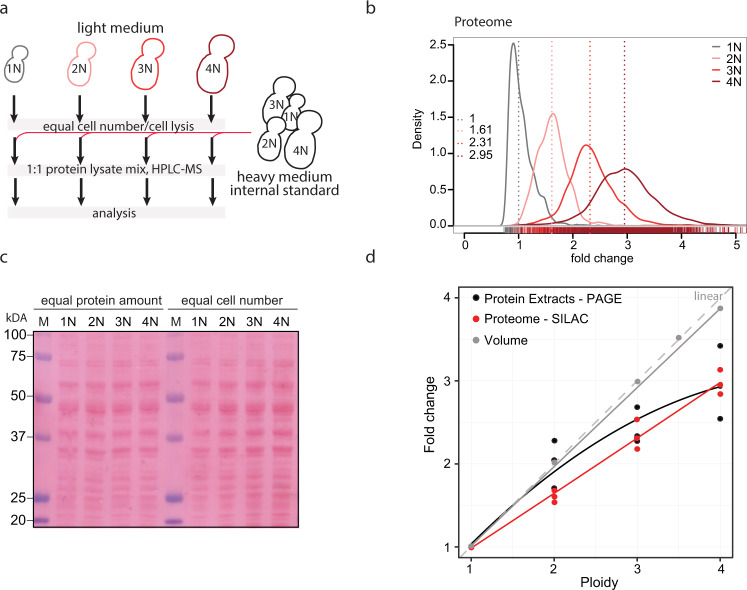
Fig. 1. Proteome changes in response to increasing ploidy.
a Schematic depiction of the strategy used for the proteome analysis. b Proteome scaling with increasing ploidy. 3109 protein groups were quantified in all ploidies. The values were normalized to the internal standard, with haploids shifted to a median at 1. All other ploidies were then shifted by the same factor. c Representative Ponceau staining of the total protein amount in cell of different ploidy when equal protein amount was loaded (left) and when proteins isolated from equal cell numbers were loaded (right). d Quantification of the volume and protein content (three independent measurements) changes with increasing ploidy with best-fit trend lines. Theoretical linear scaling is depicted in gray dashed line. Source data are provided in Supplementary Table 1 and in a Source Data file.

