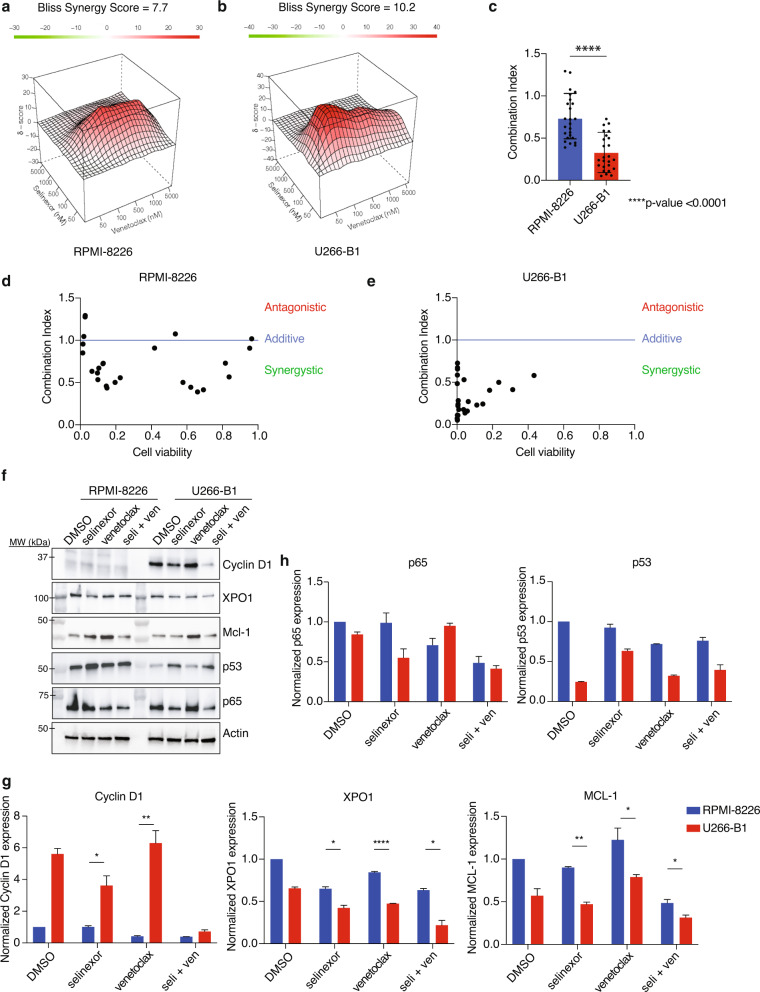
Fig. 2. Combination of selinexor and venetoclax shows significant synergy and leads to a decrease in Cyclin D1, XPO1, and MCL-1 protein levels in U266-B1.
RPMI-8226 and U266-B1 were treated with increasing doses of selinexor and venetoclax for 72 h, and cell viability was measured using CellTiter Glo. Contour plots were calculated using the Bliss Independence model and were generated using the Synergy Finder web application. Red indicates synergism and green indicates antagonism (a, b). The synergy of RPMI-8226 and U266-B1 was compared using Combination Index (CI) values. The difference was measured using Student’s t test (c). RPMI-8226 and U266-B1 synergy was also calculated using the CompuSyn software. Combination Index values >1 indicates antagonism, =1 indicates additivity, <1 indicates synergy (d, e). RPMI-8226 and U266-B1 were treated with selinexor (200 nM) and venetoclax (1 µM) for 24 h and subjected to a western blot using various antibodies as indicated (f). The normalized protein levels of Cyclin D1, XPO1, MCL-1, p65, and p53 was calculated by the intensity of the western blot bands using ImageJ software (g, h).

