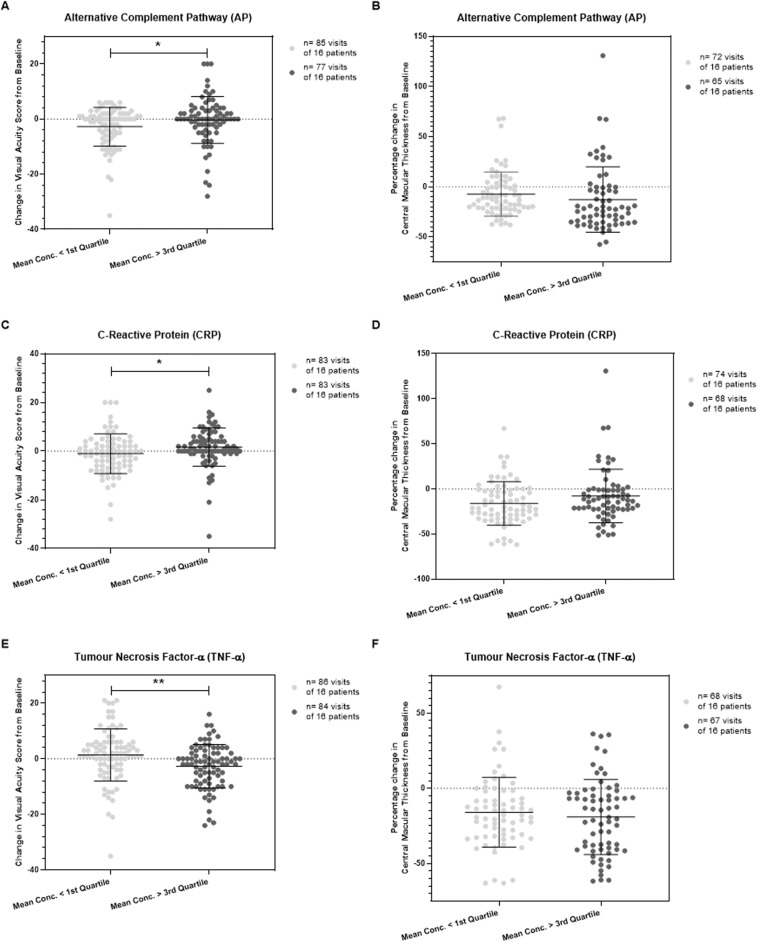
Fig. 2. Change in visual acuity score (VAS) and central macular thickness (CMT) associated with serum concentration of alternative complement pathway components and inflammatory proteins.
Study participants were stratified into quartiles according to average serum concentration of an investigated inflammatory protein (including pro-inflammatory cytokine) or complement pathway-specific components over seven study visits. The change in VAS from baseline at each visit is plotted for all study patients who had a mean serum concentration of inflammatory protein or complement pathway component below the first quartile and above the third quartile. The percentage change in CMT from baseline at each visit is also plotted for the same study participants. Shown in parts (A,B) are the results for alternative complement pathway components and change in VAS or CMT from baseline at each study visit for patients below or above the indicated quartiles; *P = 0.048. Shown in parts (C,D) are the results for C-Reactive Protein (CRP) and change in VAS or CMT from baseline at each study visit for patients below or above the indicated quartiles; *P = 0.029. Shown in parts (E,F) are the results for Tumour Necrosis Factor-α (TNF-α) and change in VAS or CMT from baseline at each study visit. **P = 0.0024. The unpaired t test, two-tailed, with Welch’s correction, was used to determine whether there was a statistically significant difference in VA or CMT change from baseline between groups.

