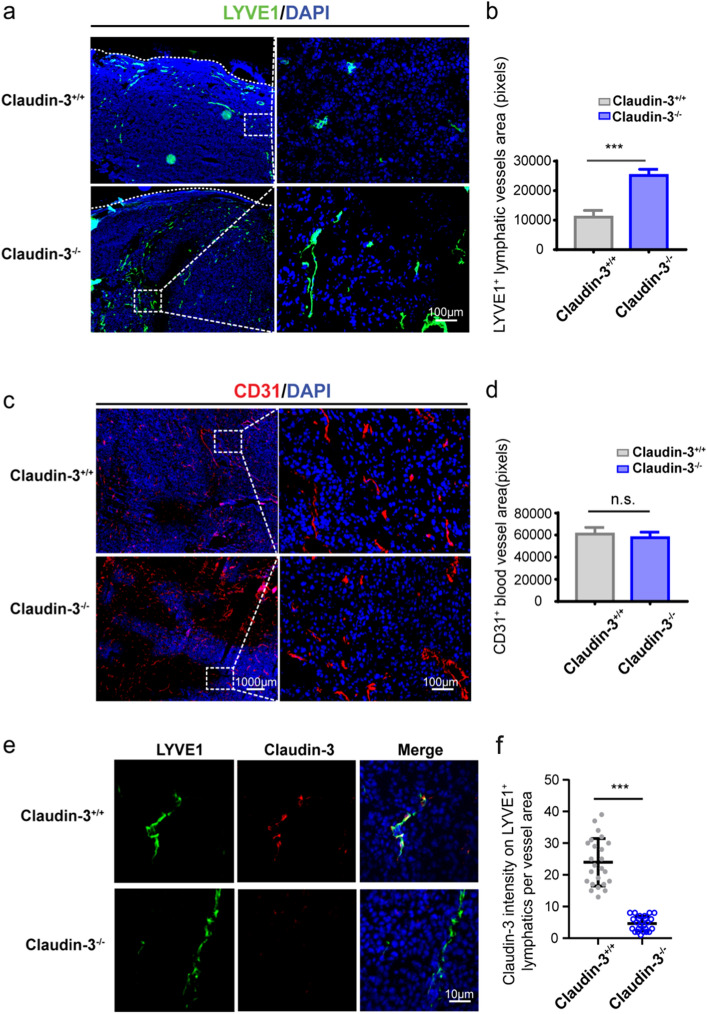
Figure 2.
Loss of claudin-3 promoted lymphangiogenesis in primary tumor tissue. (a) Representative images of the lymphatic vessel marker LYVE-1 staining (green staining) in melanoma tissue of claudin-3+/+ and claudin-3−/− mice. Dashed lines indicate margin of tumor tissue. Left panel: 4X picture; scale bar, 1000 μm. Right panel: 20X picture; scale bar, 100 μm. (b) Statistical analysis of the lymphatic vessels under a high magnification (20X) fluorescence microscope. Values are shown as the mean ± SEM. (***p < 0.001) (n = 20 fields per group) (c) Representative images of CD31 staining (red staining) in melanoma tissue of claudin-3+/+ and claudin-3−/− mice. Left panel: 4X picture; scale bar, 1000 μm. Right panel: 20X picture; scale bar, 100 μm. (d) Statistical analysis of the blood vessels under a high magnification (20X) fluorescence microscope. Values are shown as the mean ± SEM. (ns: no significance) (n = 20 fields per group) (e) Co-staining of tumor tissue from the claudin-3+/+ and claudin-3−/− mice with anti-LYVE-1 antibody (green staining) and anti-claudin-3 antibody (red staining). Scale bar, 10 μm. (f) Quantification of claudin-3 fluorescence intensity on LYVE-1 + lymphatics in e. (***p < 0.001) (n = 24 vessels per group).

