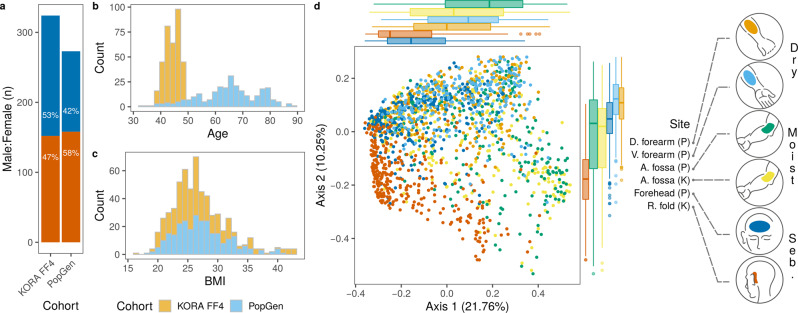
Fig. 1. Characteristics of KORA FF4 and PopGen cohorts.
a Female (orange) and male (blue) composition of cohorts. b age and, c body mass index (BMI) distribution in cohorts. d ordination of skin microbiome profiles based on Bray-Curtis dissimilarity and principal coordinates analysis. Samples (n = 1,656) were colored by the skin site and represent dry [dorsal (D.) forearm (n = 260) and volar (V.) forearm (n = 251)], moist [antecubital (A.) fossa (n = 318 in KORA FF4, n = 258 in PopGen)] and sebaceous [seb.; forehead (n = 252) and retroauricular (R.) fold (n = 317)] microenvironments. Cohort names were abbreviated, PopGen (P) and KORA FF4 (K). Marginal boxplots are shown to visualize sample distributions along axes. The boxplot area represents the interquartile range (IQR) divided by the median. Lines extend to a maximum of 1.5 × IQR beyond the area. Points are outliers. Percentage of variation explained by each axis is shown in parentheses.

