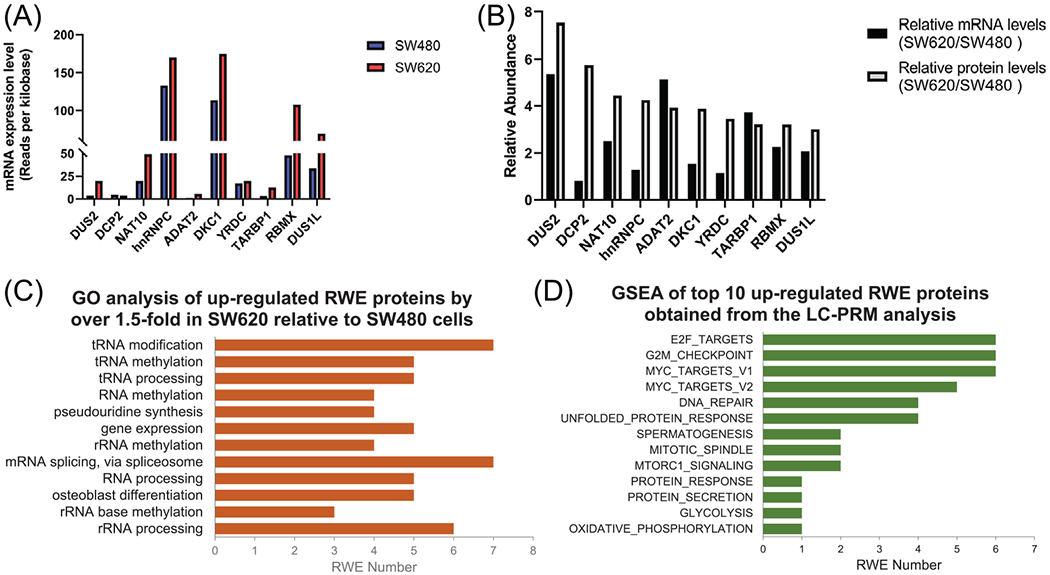
FIGURE 3.

(A) mRNA expression levels of the top 10 up-regulated RWE genes identified from LC-PRM analysis. The data were retrieved from the CCLE database. (B) The comparison of relative mRNA levels obtained from the CCLE database and relative protein levels of the top 10 up-regulated RWE genes in SW620 versus SW480 cells, as obtained from LC-PRM analysis. (C) A bar graph illustrating GO analysis on biological process (BP) of all up-regulated RWE genes. The BP results were sorted by Benjamini FDR from smallest to largest using 0.01 as a cutoff. (D) A bar graph showing GSEA results of the sum of particular enriched gene sets of top 10 up-regulated RWE genes identified from LC-PRM analysis. TCGA-COAD dataset was first stratified to high- and low-expression groups using the median value of mRNA expression of a specific RWE protein among all patient tissues. The significance level in GSEA analysis was defined as nominal p-value < 0.01 and FDR q-value < 0.25. The number of permutations was set at 1000
