
FIGURE 4.
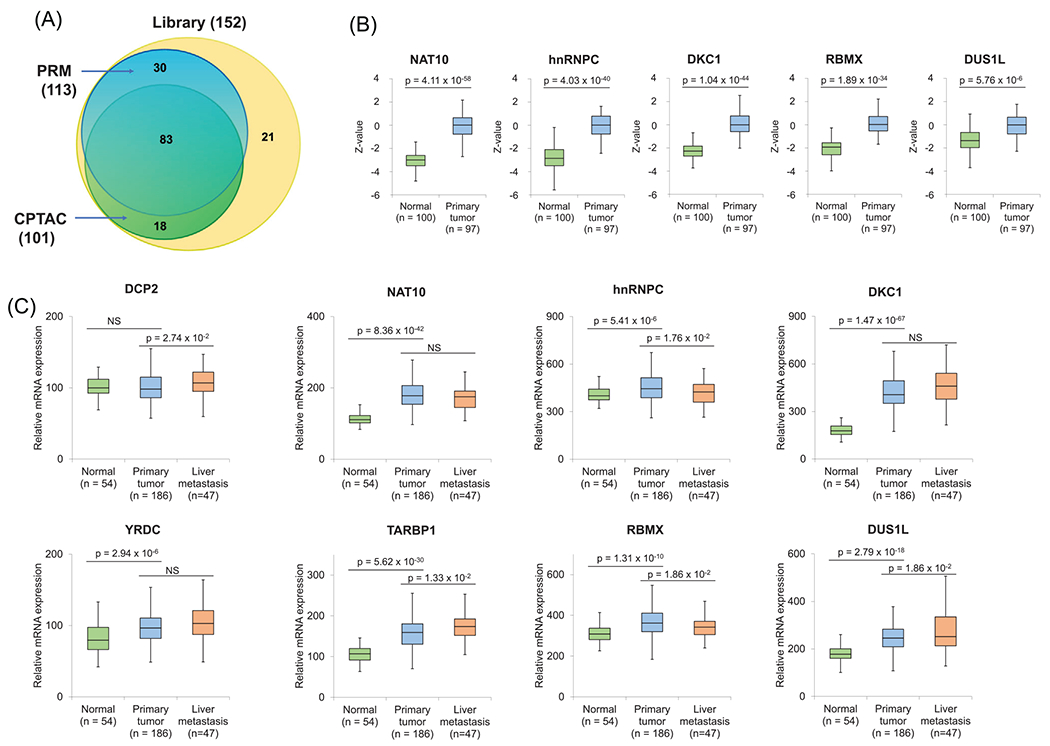
(A) A Venn diagram illustrating the number of RWE proteins quantified from the PRM analysis in this study and the previously reported CPTAC analysis, in comparison with the total number of RWE proteins deposited in the PRM library. (B) Relative protein expression levels of NAT10, hnRNPC, DKC1, RBMX, and DUS1L in primary colon tumor tissues and tumor-adjacent normal tissues in the CPTAC samples. Z-values represent SD from the median across samples. (C) Relative mRNA expression levels of DCP2, NAT10, HNRNPC, DKC1, YRDC, TARBP1, RBMX, and DUS1L genes in normal tissues, primary colon tumor tissues, and liver metastasis tissues in GSE41258. The p values were calculated using an unpaired two-tailed Student’s t test. For (B-C), the horizontal edges and inner line of the box illustrate the upper/lower quartiles and median, respectively. The top/bottom ends of the whisker denote the maximum/minimum values