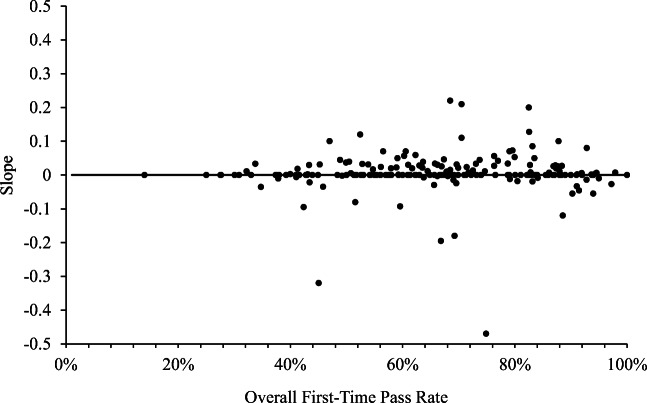
Figure 4.
Change in First-Time Pass Rates for BCBA VCSs. Note. Only VCSs with at least 2 years of published data between 2013 and 2020 are included (n = 110). Positive slope values indicate an increase in first-time pass rates over time (76 VCSs). Negative slope values indicate a decrease in first-time pass rates over time (31 VCSs). Data points falling on zero indicate no change in first-time pass rates (1 VCS). The farther from zero the steeper the change.

