
TABLE 2.
Confocal microscopy measurements of primary carious lesions after treatment with 59Ab (study 2)a
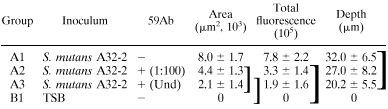 |
a
59Ab, rat antiserum to S. mutans A32-2 59-kDa protein (the dilution is shown in parentheses [Und, undiluted]). Group A1 received rabbit normal sera. Values for area, total fluorescence, and depth are the mean ± the standard error of the mean (n = 7 for group A1; n = 9 for groups A2, A3, and B1). Groups within brackets were not significantly different (P > 0.05), as determined by Tukey's procedure.