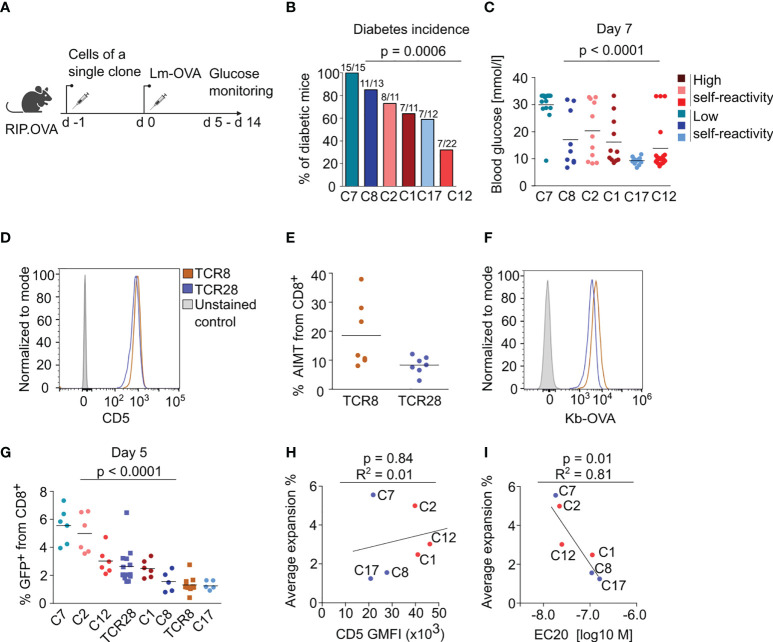
Figure 3.
The self-reactivity does not dictate the magnitude of immune response of naïve CD8+ T cells. (A-C) 104 CD8+ T cells from the indicated clone were transferred into RIP.OVA mice. The next day, mice were infected with Lm-OVA. Urine glucose levels were monitored on a daily basis on days 5-14 post infection. (A) Scheme of the experiment. (B) Percentage of the diabetic mice is shown. Number of the diabetic mice and total number of mice per group is indicated on top of each column. Three (C1, C2, C8, C17) or four (C7, C12) independent experiments. For the incidence of diabetes over time, see Figure S3B . (C) Glucose concentration in blood on day 7 post-infection. Mean. Clone 1: n=11, Clone 2: n= 11, Clone 7: n=15, Clone 8: n=13, Clone 12: n=22, Clone 17: n=12. (D–F) Phenotypic analysis of two additional monoclonal TCRs reactive to OVA, TCR8 and TCR28. Splenocytes and LN cells were isolated from sub-lethally irradiated Ly5.1 mice transplanted with the indicated clones and CD8+ T cells were analyzed by flow cytometry. (D) Expression of CD5 in CD8+ LN cells. A representative experiment out of three in total. (E) Percentage of AIMT (CD44+ CD49-) T cells among CD8+ splenocytes. Mean. n = 5 mice per group from two independent experiments. (F) Staining of monoclonal LN cells with fluorescently labeled Kb-OVA tetramer. A representative experiment out of three in total. (G) Monoclonal naïve (CD44-) CD8+ T cells were sorted from LN cells and adoptively transferred to polyclonal Ly5.1 host mice (10 000 cells/mouse), which were infected one day later with transgenic Lm-OVA. Five days after the infection, the percentage of adoptively transferred GFP+ T cells among all CD8+ T cells was determined by flow cytometry. Mean. n = 6-12 per group from three independent experiments. The statistical significance was calculated using the Kruskall-Wallis test. (H, I) A linear fit between average expansion and (H) CD5 gMFI or (I) EC20 of the tetramer staining. The Pearson correlation coefficient and p value is shown.

