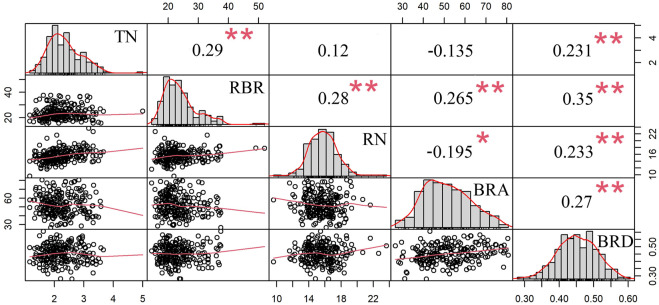
FIGURE 5.
Correlations between BRA, BRD and three other brace root traits. The diagonal plot represents the frequency of the phenotypic distribution between the brace root angle, the brace root diameter, and the other three brace root traits. The value above the diagonal is Pearson’s correlation coefficient between the two traits. Below the diagonal is a scatter plot of two traits. * represents significant difference at the 0.05 level; ** represents significant differences at the 0.01 level. BRA, brace root angle, BRD, brace root diameter, TN, tier number of the brace root, RBR, radius of the brace root, RN, number of the brace root.

