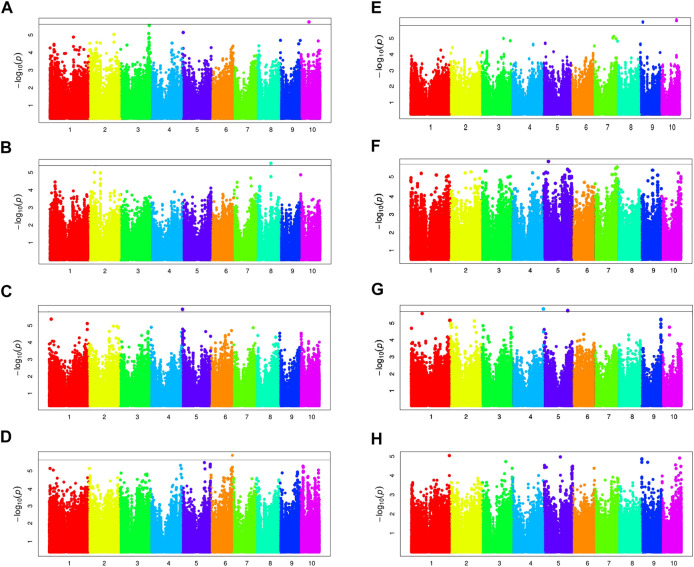
FIGURE 6.
Manhattan plots of BRA and BRD by MLM. Manhattan plots for BRA-BLUP, 16LN-BRA, 16JL-BRA, 17LN-BRA, BRD-BLUP, 16LN-BRD, 16JL-BRD and 17LN-BRD are shown in (A), (B), (C), (D), (E), (F), (G) and (H), respectively. The black lines show genome-wide significance at stringent thresholds of 1.84 × 10⁻⁶.

