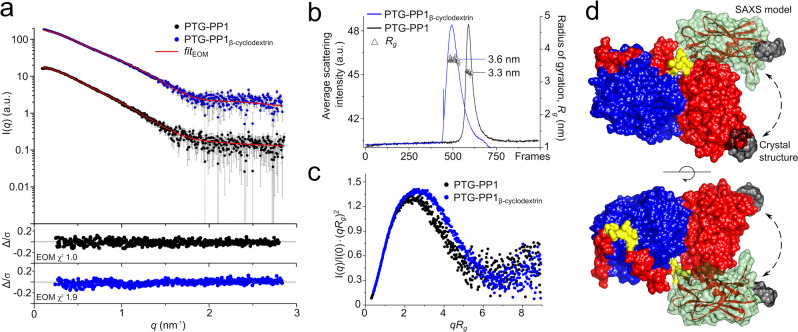
Fig. 5. SAXS studies on the binary and ternary PTG-PP1 complexes.
a Shown are I(q) versus q experimental SAXS profiles for apo PTG-PP1 (black dots) and bound to cyclodextrin (blue dots) with the EOM fit (red lines). SAXS curves were obtained through averaging of buffer-background subtracted frames across the entire elution traces of the SEC-SAXS experiments (approximately n = 50 frames averaged, see Supplementary Table 4). Error bars represent an estimate of the experimental error, σ, on the intensity recorded for each value of q assigned by data reduction software57, 58. Chi2 values (χ2) for the EOM fitting are indicated. The curves are shifted by an arbitrary offset for better comparison. The lower plots show the error-weighted residual difference plots. b SEC-SAXS chromatograms of PTG-PP1 complex alone and bound to β-cyclodextrin. The black and blue lines represent the total summed scattering intensity for PTG-PP1 and PTG-PP1 + β-cyclodextrin, respectively; triangles represent the calculated radius of gyration, Rg in nm, in the selected frames. c Dimensionless Kratky plots for PTG-PP1 complex alone (black circles) and bound to β-cyclodextrin (blue circles). d Superposition of an illustrative 3D EOM structure describing the ternary complex together with the corresponding X-ray crystal structure solved in this study. All the structures are represented in surface mode. PP1 protein is shown in blue; the PTG segments from residue 83–102 and from 111 to 128 are shown in red; missing PTG residues were modeled with EOM and shown in yellow. In red, the PTG CBM21 domain bound to β-cyclodextrin (in dark gray) in the position interacting with PP1 as observed in the crystal structure. In light green with transparency, the EOM model for PTG CBM21 domain bound to β-cyclodextrin and unbound from PP1.

