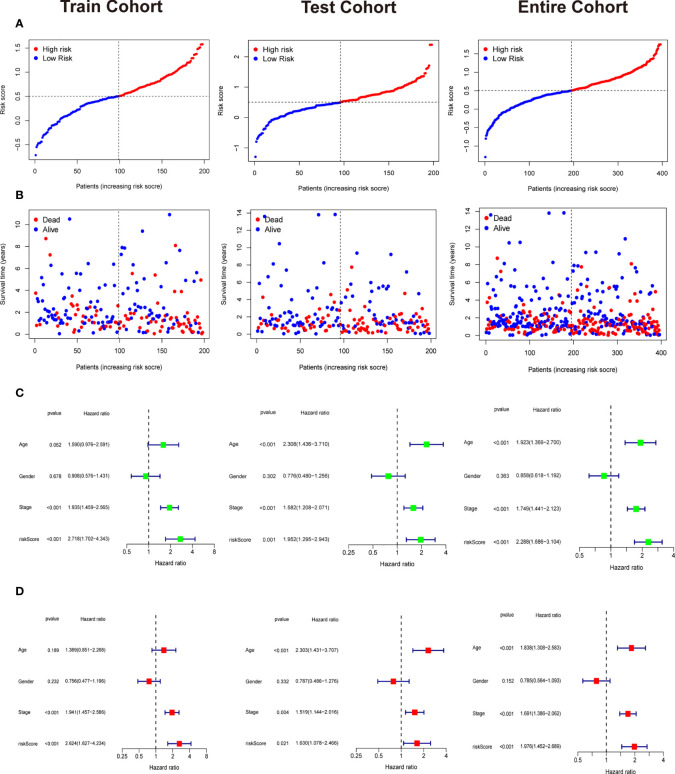
Figure 6.
Independent prognostic analysis and the correlation between survival status and riskscore. (A) The riskscore curve in train cohort, test cohort, and entire cohort. (B) Patients’ status as riskscore increases in train cohort, test cohort, and entire cohort. (C) Univariate Cox analysis in train cohort, test cohort, and entire cohort. (D) Multivariate Cox analysis in in train cohort, test cohort, and entire cohort.

