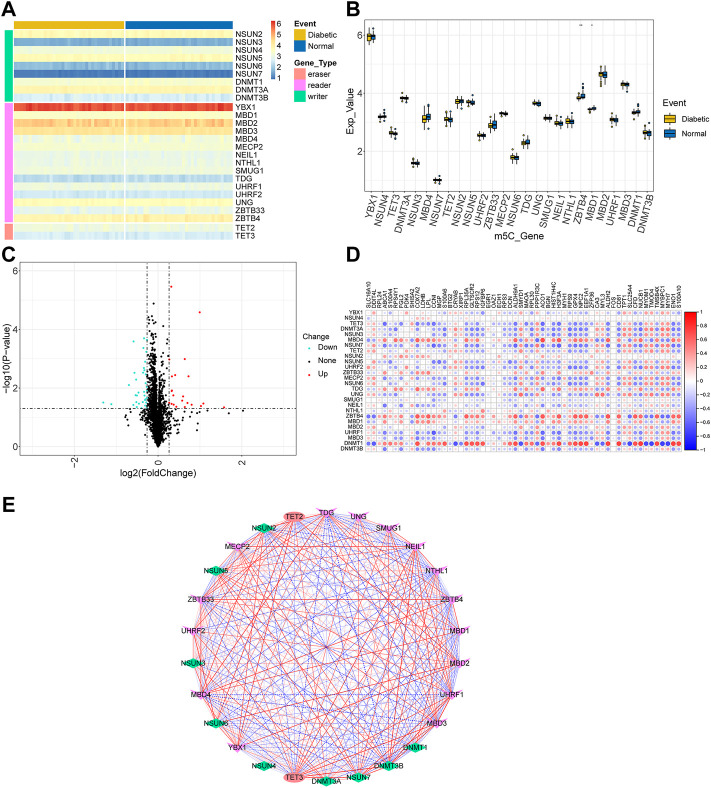
FIGURE 2.
Landscape of m5C-related genes. (A) Heatmap of the m5C-related genes. (B) Boxplot of m5C-related genes. Ns indicates not significant (p > 0.05), and *p < 0.05, **p <0.01, ***p <0.001, ****p < 0.0001 represent significant p-values. (C) Volcano plot of T2D-related differentially expressed genes. (D) Correlations among m5C-related genes and T2D-related differentially expressed genes. (E) Network diagram of the correlation interaction between m5C-related genes.

