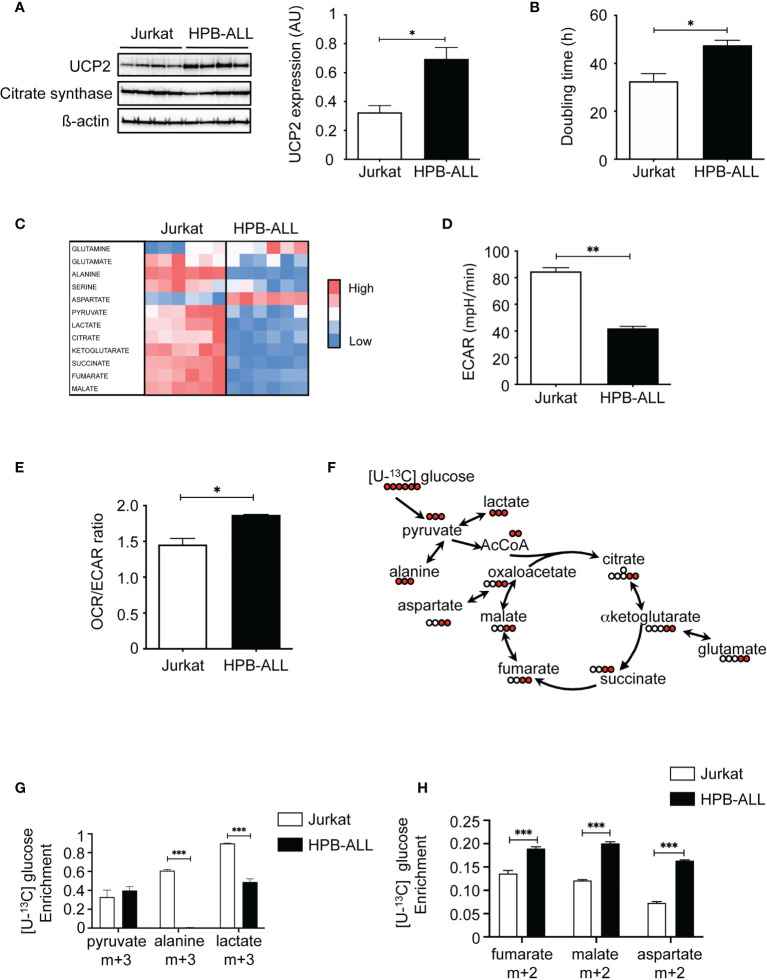
Figure 1.
T-ALL cell lines exhibiting different UCP2 steady-state expression differ in doubling time and oxidative capacities. (A) UCP2, citrate synthase (CS) and ß-actin immunoblots in whole cell extracts of Jurkat, and HPB-ALL cell lines cultured in complete medium (n = 4). Quantification of UCP2 steady-state expression normalized to ß-actin; data are expressed as mean ± SEM (n = 4). (B) Doubling time in hours evaluated for 72 hours of culture in complete medium; data represent mean ± SEM (n = 4). (C) The relative abundance of 12 metabolites measured by liquid chromatography–tandem mass spectrometry (LC-HRMS) is visualized as a heat map representation (blue color corresponds to low values and red to high values) by distinguishing the number of samples. Jurkat cells and HPB-ALL cells were cultured in complete medium. (D) Measurement of ECAR (mpH/min) from the Jurkat and HPB-ALL cell lines. Data are expressed as mean ± SEM (n = 6). (E) Basal energy metabolism in complete medium was assessed by analyzing the OCR/ECAR ratio measurement with SeaHorse XF96 equipment in Jurkat and HPB-ALL cells; data are expressed as mean ± SEM (n = 3). (F) Representation of the labeling scheme using [U-13C] glucose. For simplicity, the labeling of the first round in the TCA cycle is displayed (red). (G) Enrichment in (m+3) pyruvate, (m+3) alanine and (m+3) lactate indicates the part derived from the oxidation of [U-13C] glucose in Jurkat and HPB-ALL cells; data are expressed as mean ± SEM (n = 3). (H) The enrichment in (m+2) fumarate, (m+2) malate and (m+2) aspartate indicates the part derived from the oxidation of [U-13C] glucose in Jurkat and HPB-ALL cells; data are expressed as mean ± SEM (n = 3). Statistical significance is represented as follows: ***p<0.001, **p<0.01, *p<0.05.

