Figure 2.
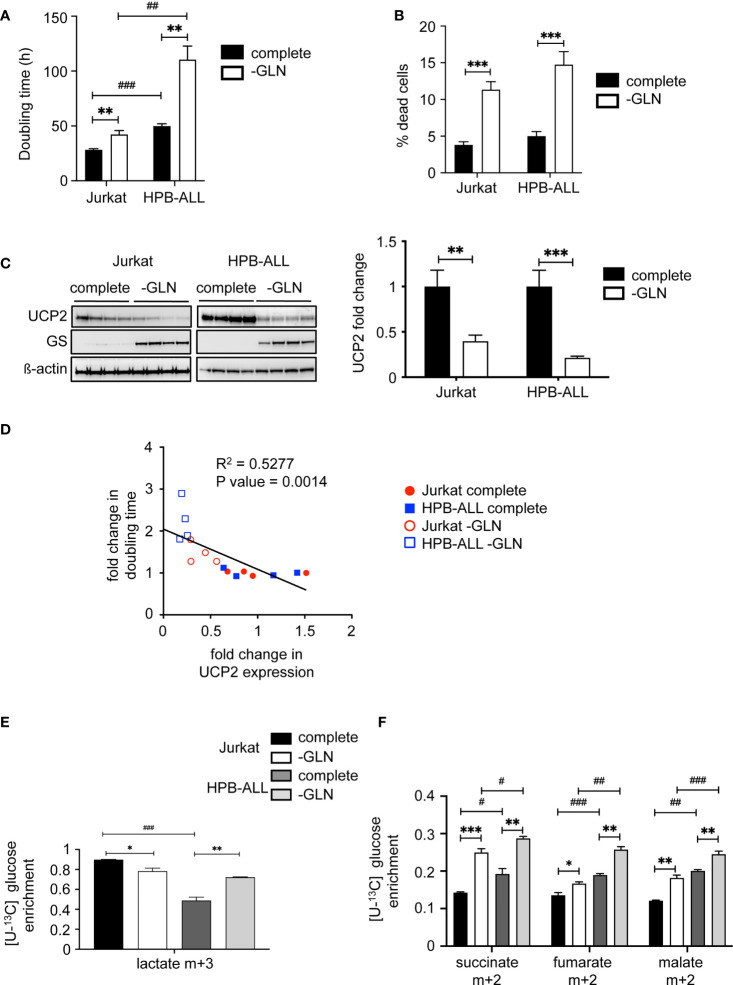
Glutamine deprivation impacts UCP2 content, proliferation rate and metabolism differentially depending on T-ALL cells. (A) Doubling time in hours evaluated for 72 hours of culture in complete (complete) or glutamine-deprived medium (-GLN); data represent the mean ± SEM (n = 4). (B) Percentage of dead cells measured by trypan blue staining. Data are expressed as mean ± SEM (n = 16). (C) Immunoblotting of UCP2 and glutamine synthase (GS) in whole cell extracts of Jurkat and HPB-ALL cell lines after 72 hours of incubation in complete or glutamine-deprived medium (-GLN) (n = 4); quantification of the steady state of UCP2 normalized to ß-actin and expressed as fold change between each individual value and the mean value of respective controls (cells in complete medium); data are expressed as mean ± SEM (n = 4). (D) Correlation between UCP2 expression and doubling time using Relative Units obtained by the ratio between each individual value and the mean value of respective controls (same cell line in complete medium) and analyzed with Spearman’s correlation test. (E) Enrichment of (m+3) lactate indicates the portion that derived from [U-13C] glucose in Jurkat and HPB-ALL cells cultured in complete medium (complete, black and dark grey respectively) (n = 6) and in glutamine deprivation medium (-GLN, white and light grey respectively) (n = 3). (F) Enrichment of (m+2) succinate, (m+2) fumarate and (m+2) malate indicates the portion that derived from oxidation of [U-13C] glucose in Jurkat and HPB-ALL cells cultured in complete medium (complete, black and dark grey respectively) (n = 6) and in glutamine deprivation medium (-GLN, white and light grey respectively) (n = 3); data are expressed as mean ± SEM. Statistical significance is represented as follows: ***p<0.001; **p<0.01; *p<0.05, and # = Jurkat vs. HPB-ALL. #p<0.05 , ##p<0.01 and ###p<0.001.

