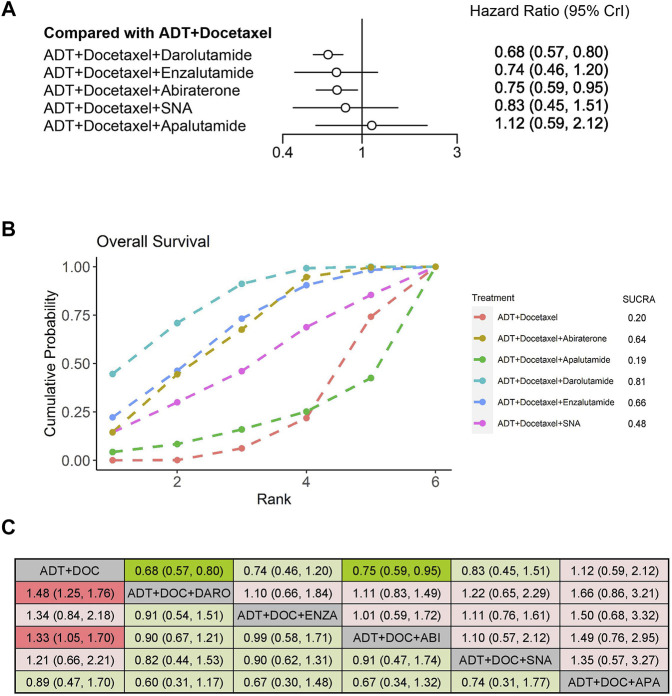
FIGURE 3.
Comparison of systemic triplet therapy for improving OS. (A) Forest plot representing HR for each therapy compared with ADT plus docetaxel. HR and 95% CrI are represented. (B) SUCRA plot showing the treatment ranking of therapies. (C) League table of network meta-analysis comparing the OS effects of systemic therapies. Comparison is located at the intersection of the column-defining treatment and the row-defining treatment. The results are presented in HR with 95% CrI. HR>1 (red color) favors row-defining treatment, and HR<1 (green color) favors column-defining treatment. Dark red or green color represents the results with statistical significance. ADT, androgen deprivation therapy; SNA, Standard nonsteroidal antiandrogen; DO,: Docetaxel; ABI, Abiraterone, ENZA, Enzalutamide; DARO, Darolutamide; APA, Apalutamide.

