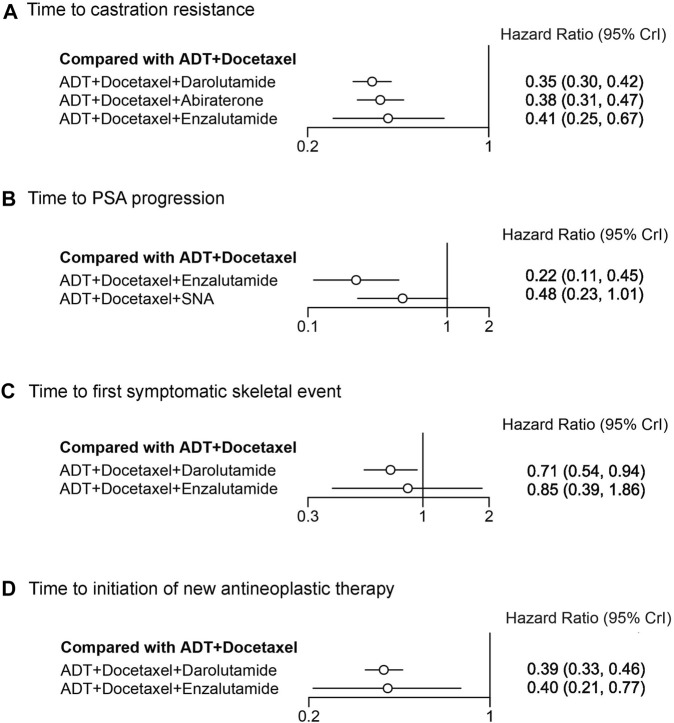
FIGURE 5.
Forest plot representing a comparison of systemic triplet therapy for improving secondary endpoints compared with ADT plus docetaxel. HR and 95% CrI are represented. (A) Time to castration resistance; (B) time to PSA progression; (C) time to the first symptomatic skeletal event; (D) time to initiation of new antineoplastic therapy.

