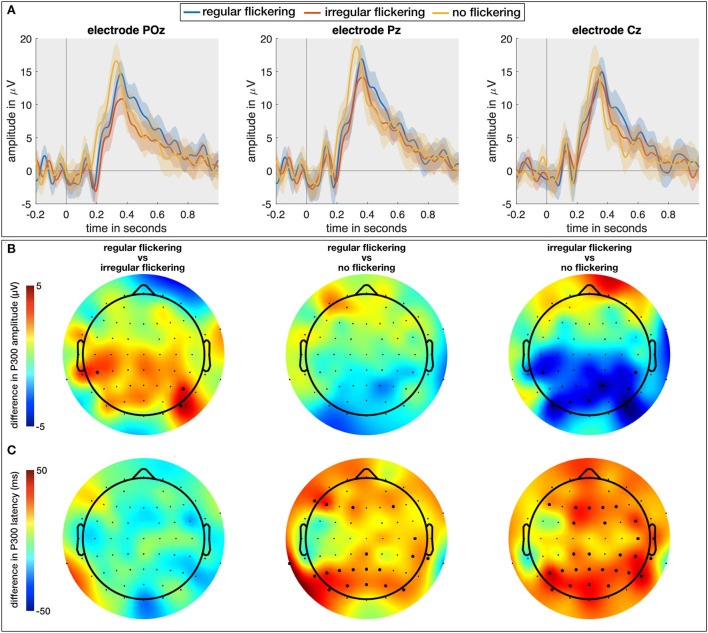
Figure 6.
(A) The temporal plots (ERPs) in response to regular-oddball, irregular-oddball, and no-flickering-oddball conditions on electrodes POz, Pz, and Cz. Shaded area indicates 95% confidence interval, full-line is the average across the subjects. (B) Difference between P300 peak amplitudes [max between 200 and 600 ms (in μV)] between groups accounting for multiple comparisons (three groups). The largest difference was observed between irregular- and no-flicker conditions with no-flicker condition exhibiting the largest P300 amplitude on several electrodes. (C) Scalp plots for differences between P300 peak latencies across three groups accounted for multiple comparisons. The P300 response to flickering stimulus (both regular and irregular) was delayed in comparison to no-flickering stimulus. The electrodes indicating a statistically significant difference in (B,C) are presented with thick dots.

