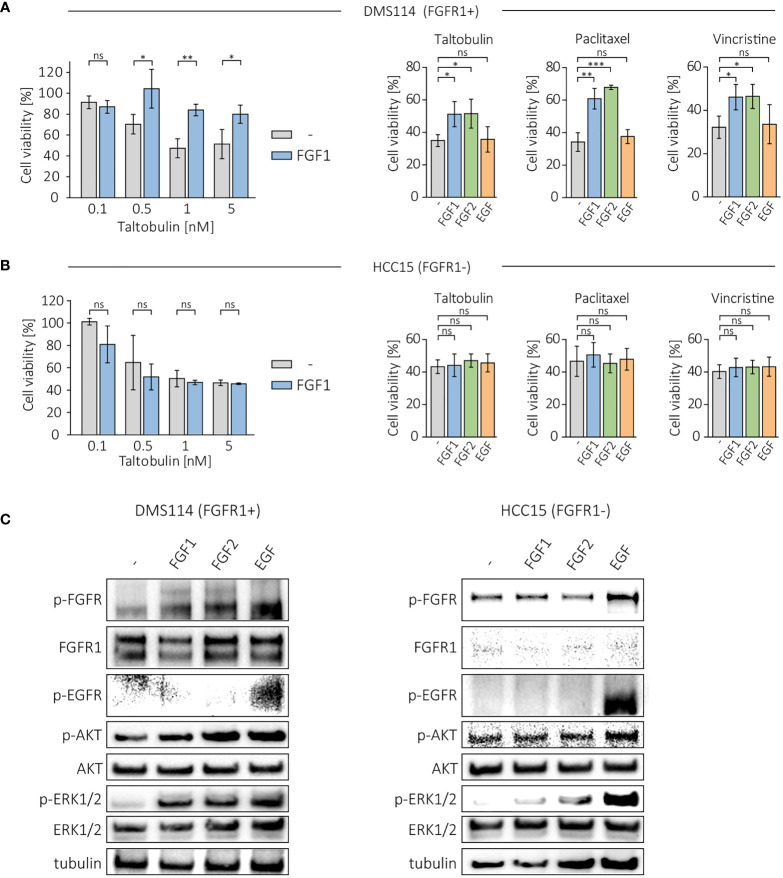
Figure 2.
Effect of FGF1, FGF2 and EGF in DMS114 and HCC15 cells treated with the indicated drugs. Viability of (A) DMS114 and (B) HCC15 cells treated with different concentrations of TLT in the presence of 10 ng/mL FGF1 for 48 h (left panels) and comparison of the effect of FGF1, FGF2 and EGF (10 ng/mL) in cells treated for 48 h with 5 nM TLT, 20 nM PTX and 10 nM VCR (right panels). Cell viability was monitored using the alamarBlue assay. Results represent the mean ± SD of at least three independent experiments and are normalized to untreated cells; statistical significance: *p<0.05, **p<0.01, ***p<0.001, no significant differences are marked as ‘ns’. (C) Western blotting analysis of FGF1, FGF2 and EGF (10 ng/mL) activity in DMS114 and HCC15 cells using anti-phospho-FGFR, anti-FGFR1, anti-phospho-EGFR, anti-phospho-AKT, anti-AKT, anti-phospho-ERK1/2 and anti-ERK1/2 antibodies. Anti-tubulin antibody served as an equal loading control.

