Figure 3.

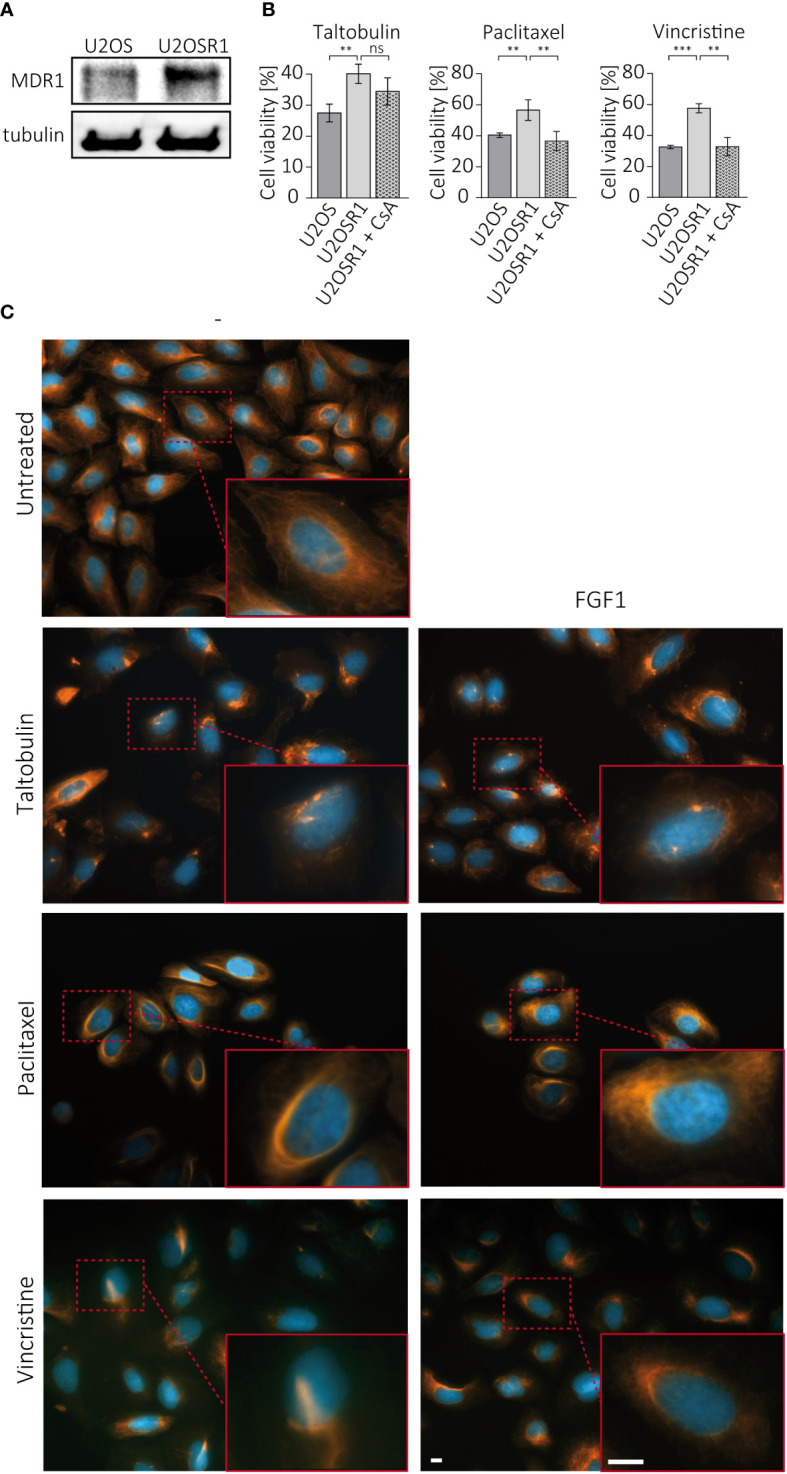
Effect of cell membrane transporters on the FGFR1-dependent protective effect against TLT, PTX and VCR. (A) MDR1 levels in U2OS and U2OS-R1 cells were analyzed by western blotting using anti-MDR1 antibody. (B) The effect of MDR1 inhibition with 10 µM cyclosporine A (CsA) on drug sensitivity in U2OSR1 cells was checked by monitoring cell viability 48 h after drug administration with the alamarBlue assay. Results represent the mean ± SD of at least three independent experiments and are normalized to untreated cells (w/o drug and CsA); statistical significance: **p<0.01, ***p<0.001, no significant differences are marked as ‘ns’. (C) Changes in microtubules structures after 24-h treatment with drugs (5 nM TLT, 20 nM PTX, 10 nM VCR) and the effect of FGF1 (10 ng/mL) on this process were visualized by fluorescence microscopy using antibodies against acetylated-tubulin. Scale bar represents 10 μm.
