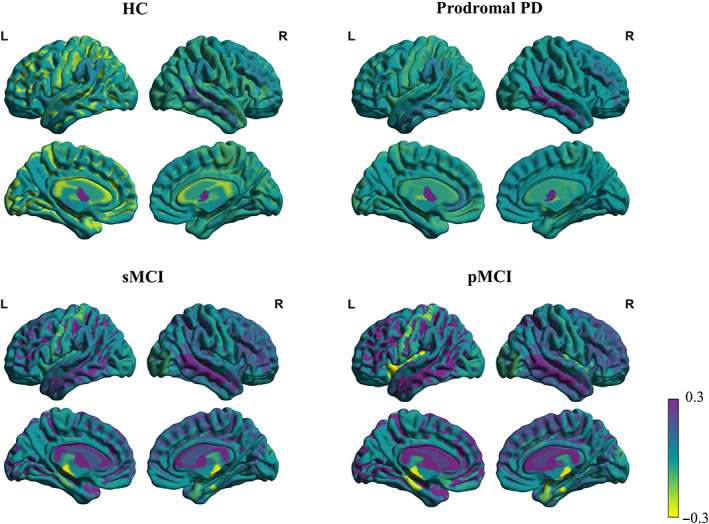
FIGURE 4.

Visualizations of the brain age vector based on the DKT atlas for HC, prodromal PD, sMCI, and pMCI. The color bar indicates the feature value (Shapley value) in the brain age vector for each brain region, measuring the degree of regional brain aging. Region values in the visualization map have been set at −0.3 minimum threshold and capped at 0.3 maximum to better show regional variations. HC, healthy control; L, left hemisphere; PD, Parkinson disease; pMCI, progressive mild cognitive impairment; R, right hemisphere; sMCI, stable mild cognitive impairment
