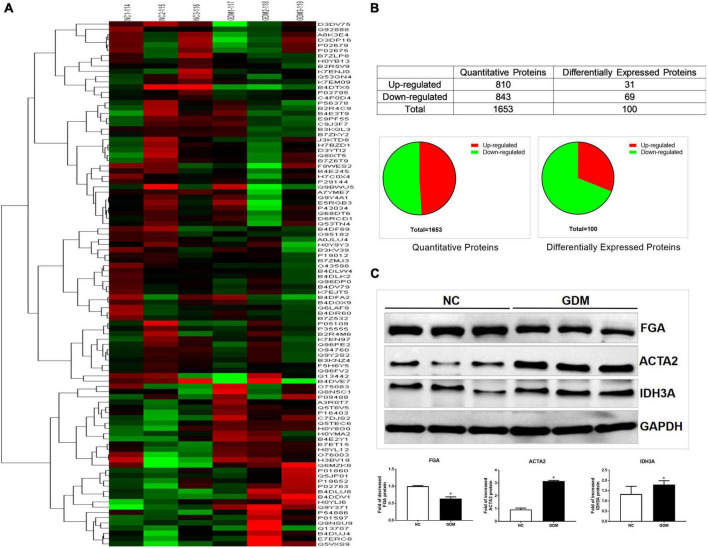
FIGURE 1.
iTRAQ analysis results for the GDM umbilical vessels. (A) Hierarchical clustering of DEPs. (B) The statistic of the proteins identified in umbilical vessels. (C) Validation of the differential expression of the selected proteins in umbilical vessels by western blotting: FGA, ACTA2, IDH3A. Data are presented as mean ± SE (n = 3). *p < 0.01.

