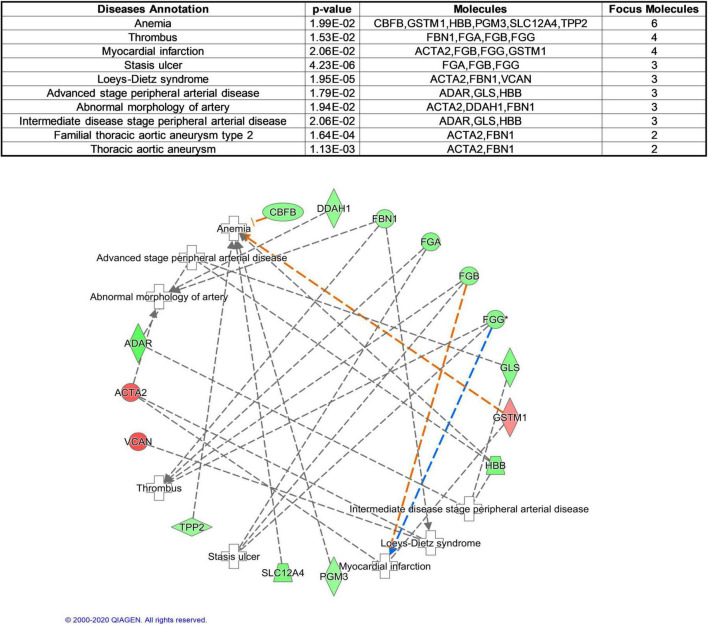
FIGURE 3.
Cardiovascular Disease analysis of differentially expressed proteins between normal and GDM umbilical vessels. For this developmental disease network, genes or gene products are represented as nodes, and the biological relationship between two nodes is represented as an edge. All edges are supported by at least one publication as stored in the Ingenuity Knowledge database. The intensity of the node color indicates the degree of up- (red) or down- (green) regulation.

