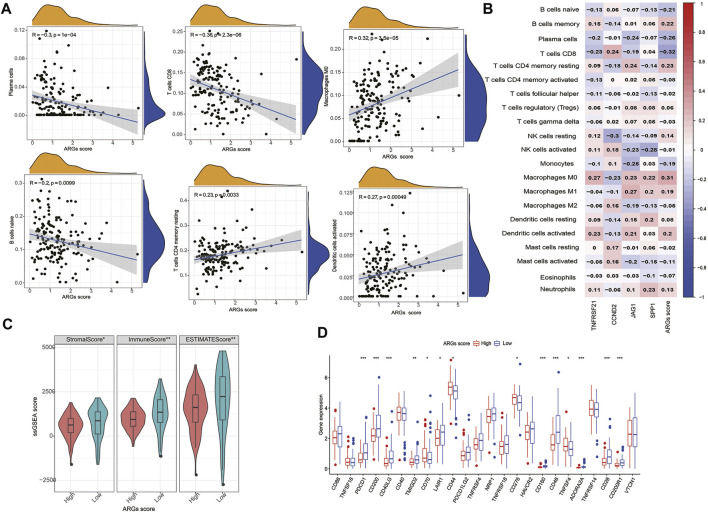
FIGURE 6.
Evaluation of the TIME and checkpoints between the two groups: (A) Correlations between ARGs score and immune cell types; (B) Correlations between the abundance of immune cells and four genes in the proposed model; (C) Correlations between ARGs score and both immune and stromal scores; (D) Expression of immune checkpoints in the high and low-risk groups. ***p < 0.001, **p < 0.01, *p < 0.05 and not significant (p > 0.05) by repeated measures with the Wilcoxon test.

