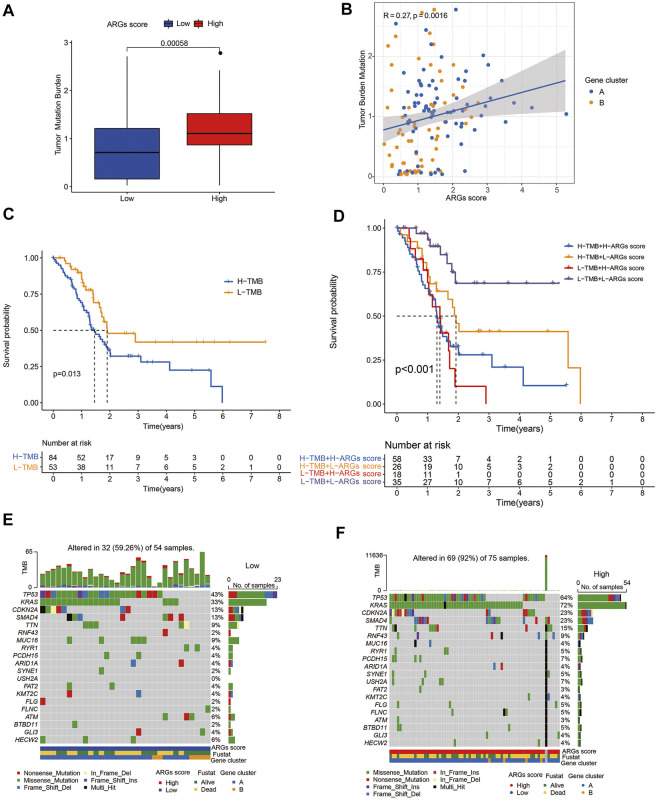
FIGURE 7.
Association of ARGs score with TMB score in PC: (A) TMB in different ARGs score groups; (B) Spearman correlation analysis of the ARGs score and TMB; (C) Kaplan-Meier analysis of the OS between the low- and high-TMB groups; (D) Survival analysis among four patient groups stratified by both TMB and ARGs score; (E,F) The waterfall plot of somatic mutation features established with low and high ARGs score.

